
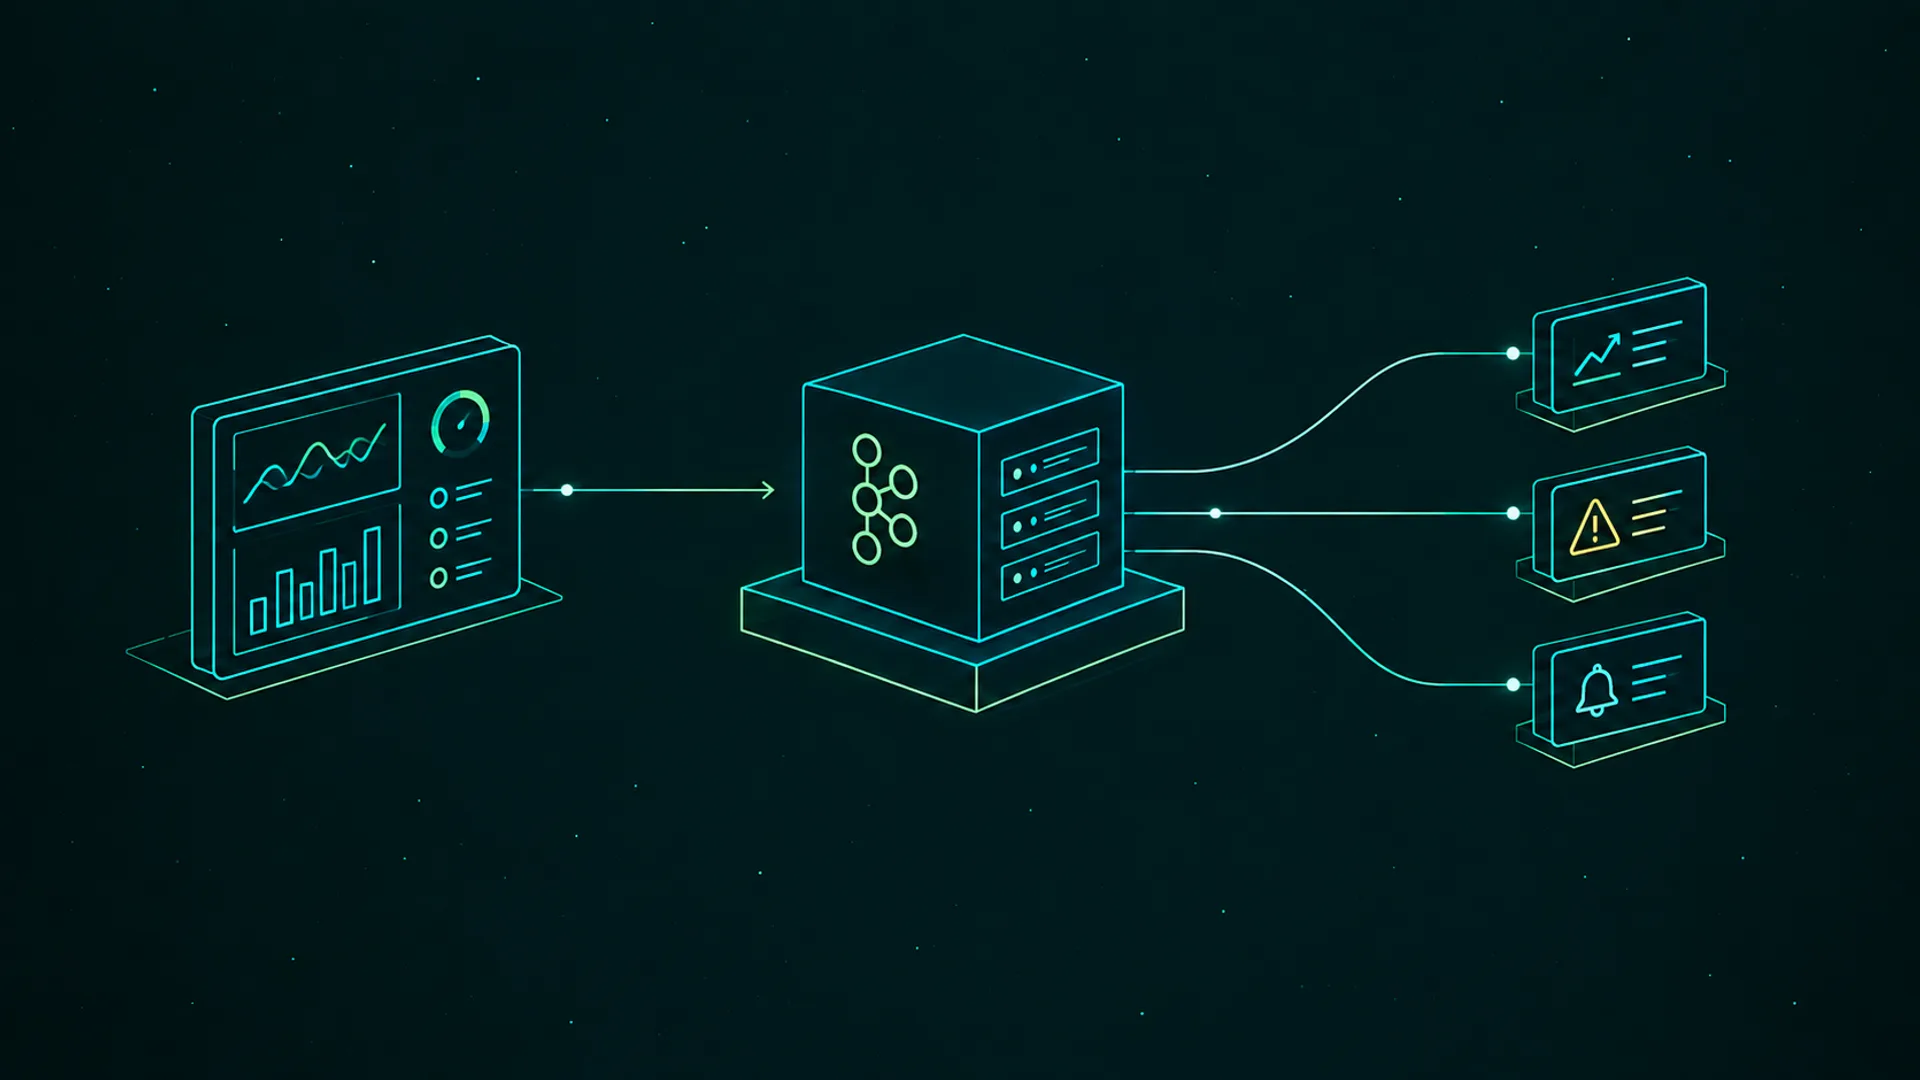
Most Kafka clusters are already being monitored. The brokers report to Datadog or a Prometheus stack, under-replicated partitions page somebody, and consumer lag has a dashboard that a few people check. When a platform team asks for the best Kafka monitoring tool, the question usually means something narrower: the alerts work, and nobody can explain them.
A lag alert names a group, a topic and a partition. It can't show the message the consumer is stuck on, the schema change that landed before it, or which team runs the consumer. Getting from the alert to those three answers is a different job from collecting metrics, and it needs a tool that understands topics, partitions and consumer groups.
So this comparison has two halves. The first is which part of Kafka each tool can see. The second is what each tool lets you do once an alert has fired.
Which part of Kafka are you monitoring?
Each level has its own source of data, and that decides which tools can see it. A broker is a JVM process, the cluster's partition state is metadata the brokers agree on, and lag is a comparison between two sets of offsets:
Heap, garbage collection and request latency only exist inside the broker's JVM, so a tool needs an agent or exporter on every broker to read them. Under-replicated and offline partitions show up in JMX too, but Kafka's Admin API also returns each partition's leader and in-sync replicas, so the same state can be worked out from outside the brokers. Consumer lag is the gap between a group's committed offset and the end of each partition, and both numbers come from the Admin API, not from broker JMX.
That's why a JMX-only setup sees the brokers clearly and misses lag, while a Kafka UI sees partitions and lag but not the JVM. The open-source stack usually ends up as two exporters for that reason, and the APM agents ship a separate consumer-offset check.
With the three levels named, here's how the common options line up on them, and on what they let you do after an alert:
| Tool | Broker JVM + requests | Partition health | Consumer lag | History + alerting | After the alert |
|---|---|---|---|---|---|
| Prometheus JMX Exporter + Grafana (open source) | Yes | Yes | No, add an exporter | Prometheus + Alertmanager | No |
| kafka_exporter or KMinion (open source) | No | Partial | Per partition | Via Prometheus | No |
| Datadog, New Relic, Dynatrace (SaaS) | Yes, via agent | Yes | Per partition | Full platform | No |
| CloudWatch (MSK only) | Depends on monitoring level | Yes | Per group + topic | CloudWatch alarms | No |
| Confluent Control Center (Confluent license) | Yes | Yes | Per partition | Alerts built in | Inside the Confluent stack |
| AKHQ or Kafbat UI (Apache 2.0) | No | Current state only | Per partition, current | None | Browse messages, reset offsets |
| Redpanda Console (BSL) | No | Current state only | Per group, current | None | Browse messages, reset offsets |
| Kpow (commercial, free tier) | No, Admin API only | Yes | Per partition | History built in, alerts via Prometheus | Search messages, manage offsets |
| Conduktor Console (commercial, free tier) | No | Yes | Per partition, messages + seconds | Built in, routed to owners | Browse messages, reset offsets, check connectors and schemas |
- The Prometheus stack is the usual default for self-managed Kafka. Kafka exposes broker metrics over JMX, the JMX exporter turns them into Prometheus metrics, and Grafana draws them. Brokers have no per-group lag metric, so lag needs a second exporter next to it.
- Cruise Control isn't in the table because it rebalances partitions rather than drawing dashboards. It does watch broker load and flags anomalies such as a failed broker, so it often runs next to whatever you pick here.
- Burrow and the other lag-only tools are compared in our consumer lag monitoring tools post.
Most teams already have the dashboard
Before picking a Kafka tool, check what your company already runs. In the conversations we have with platform teams, the observability platform is usually chosen above them, and adding a second one is a hard sell:
"I don't know if we'd wanna have another set of, like, redundant dashboards." — Kafka platform engineer, payments company
If that platform is Datadog, Dynatrace or New Relic, its Kafka integration covers broker and partition metrics through an agent, plus a consumer-offset check for lag. You get history, alerting and paging in the tool your on-call engineers already use. On MSK, CloudWatch publishes broker, partition and per-group lag metrics. On Confluent Platform, Control Center is already licensed.
The gap is the same in all of them: they store numbers. When lag climbs on one partition, a metrics platform tells you which partition and since when, and the investigation has to continue somewhere else.
What happens after the alert fires?
An alert hands you a consumer group and a topic, and the investigation starts there. One platform engineer described the split between the two jobs clearly:
"Step one is having the alert and having the earlier response, and that's what our Zabbix is doing." — Platform engineer, healthcare software company
Step two, for that team, is opening a Kafka tool to drill down. That's where Kafka UIs like AKHQ, Kafbat UI and Redpanda Console help: they show current partition state, consumer offsets and the messages themselves, and they let you reset offsets. They don't keep history or send alerts, so they sit next to a metrics stack rather than replacing it.
Conduktor Console does both jobs in one place. By default, its indexer collects metrics from your clusters every 30 seconds: offline, under-replicated and under-min-ISR partitions, active brokers and controllers, disk usage, topic throughput, and lag per partition in messages and in estimated seconds.
Alerts on those metrics go to Slack, Teams, email or a webhook, and every alert has an owner: a user, a group or an application instance. That lets a lag alert go to the team that runs the consumer instead of the platform team. The investigation then happens in the same Console: open the consumer group, browse the messages on the stuck partition, and reset offsets if you need to.
Console doesn't read broker JVM metrics such as heap or request latency, so keep a JMX exporter or your APM agent on the brokers for those.
Where the metrics live. Console stores its metrics in a bundled Cortex, or in your own Prometheus, Mimir or Cortex. It also publishes them at
/api/monitoring/metrics, so the platform your company already uses can scrape the same numbers. The free Community Edition shows the last hour of metrics. History and alerts need a paid plan.
Which tool should you pick?
Start from what your company already runs, because the alerting half is usually decided before you arrive:
- Already on Datadog, Dynatrace or New Relic. Turn on the Kafka integration and its consumer-offset check, and keep alerting where your on-call engineers already work. Plan separately for the investigation side.
- On MSK. CloudWatch covers broker and partition health and basic lag alarms. Add a Kafka UI for investigation.
- On Confluent Platform. Control Center is already licensed and covers the Confluent stack in one place.
- Self-managed and open source only. The JMX exporter plus kafka_exporter or KMinion into Prometheus, Grafana for dashboards, and AKHQ or Kafbat UI for investigation. It's several components by design, and each one is free.
- Prometheus already running, and you want a deeper ops UI. Kpow adds message search, filters and offset management on top of the Prometheus alerting you already run.
- You want alerts and investigation in one tool, owned by the teams. Conduktor Console collects partition and lag metrics, routes each alert to the team that owns the resource, and lets that team investigate in the same place. It can also feed the same metrics to your Prometheus.
The best Kafka monitoring tool is usually the one your company already pays for, plus something that can explain an alert. Keep metrics and paging in your observability platform, and pick the Kafka tool by how quickly it gets you from an alert to the partition, the message and the team that owns it.
Does Kafka have built-in monitoring?
Kafka exposes broker metrics over JMX and ships CLI tools such as kafka-consumer-groups.sh. It has no dashboard, no metric history and no alerting, so you add those with a separate tool.
What should I monitor in Kafka first?
Offline partitions, under-replicated partitions, partitions below min.insync.replicas, the active controller count, broker disk usage, and consumer lag per group. Add JVM heap and request latency from JMX once those are covered.
Is Prometheus enough for Kafka monitoring?
For metrics and alerts, yes, with the JMX exporter on the brokers and a lag exporter for consumer groups. It doesn't let you inspect messages or reset offsets, so most teams pair it with a Kafka UI.
Can I monitor Kafka for free?
Yes. The Prometheus stack and the open-source Kafka UIs are free to run. Several commercial tools also have free tiers, usually with limits on metric history or cluster count.
Related: Best Tools for Monitoring Kafka Consumer Lag → · Kafka Consumer Lag Monitoring → · Multi-Team Kafka Alerting →