
"What's the best tool to monitor Kafka consumer lag?"
Plenty of tools can show you Kafka consumer lag, but not all of them can help you remediate the incident behind it. Monitoring tells you that lag is growing, while fixing it means chasing down causes: which partition is stuck, what message it's stuck on, and whether the consumer is even alive, to name a few. So without further ado, let's survey the options for consumer lag monitoring, and weigh what you personally need in your day to day as a Kafka developer.
| Tool | Lag detail | Time lag | History + alerting | After the alert |
|---|---|---|---|---|
| kafka-consumer-groups.sh (Apache 2.0) | Per partition, snapshot | No | None | Offset resets only |
| Burrow (Apache 2.0) | Per partition, windowed | No | Status notifiers | No |
| KMinion (MIT) | Per partition | No | Via Prometheus | No |
| kafka_exporter (Apache 2.0) | Per partition | No | Via Prometheus | No |
| Kafka Lag Exporter (archived) | Per partition | Yes | Via Prometheus | No |
| Datadog (SaaS) | Per partition | Via DSM add-on | Full platform | No |
| New Relic (SaaS) | Per partition | No | Full platform | No |
| CloudWatch (MSK only) | Per group + topic | Yes | CloudWatch alarms | No |
| Confluent (license / SaaS) | Per partition | No | Alert triggers | In the Confluent stack |
| AKHQ (Apache 2.0) | Per partition | No | None | Browse + reset offsets |
| Kafbat UI (Apache 2.0) | Per partition | No | None | Browse + reset offsets |
| Redpanda Console (BSL) | Per group | No | None | Browse + reset offsets |
| Kpow (commercial, free tier) | Per partition | No | History built in; alerts via Prometheus | Browse + search + offset management |
| Conduktor Console (commercial, free tier) | Per partition | Yes | Built in | Browse, schema + connect checks, reset with preview |
- Burrow is still maintained, just at a slower pace than its popularity suggests. It also works differently from the rest: instead of asking you to pick a lag threshold, it judges each group by its recent commit history, which suits fleets with hundreds of groups.
- Kafka Lag Exporter is in the table because many teams still run it, but it's archived, so treat it as legacy. Its closest successor is Klag, which adds lag velocity and time-based estimates, though it's under a year old, so evaluate it before relying on it.
- Kpow stores its own lag telemetry in internal Kafka topics, so you get lag history without running Prometheus, though alerting still goes through Prometheus and Alertmanager.
- Kafbat UI is where the former kafka-ui contributors now work, so point new deployments there.
- Grafana Cloud, if you run it, wraps kafka_exporter with ready-made lag alerts through its Kafka integration, so you don't have to assemble that stack yourself.
Which lag number do you actually need?
In Kafka, offset lag counts messages behind, so most tools report it because it's a cheap metric to grab: just read the __consumer_offsets topic, or query the same offset APIs the Kafka CLI uses. Broker JMX won't give you consumer lag, because brokers have no per-group lag metric, and the client-side records-lag metrics die with the consumer process, which is exactly when you need them.
Time lag turns that count into seconds. This is often a more desirable number, because ten thousand messages behind is an emergency on a quiet topic and background noise on a busy one.
But even when time lag is measured, it's usually an estimate, and each tool computes it differently:
- Kafka Lag Exporter works backward from offset history.
- MSK's
EstimatedMaxTimeLagand Conduktor's time lag work forward: how long the backlog takes to drain at the current consume rate. - Datadog's Data Streams Monitoring measures from inside the clients.
If you set an SLO on seconds of lag, check which one your tool computes.
What can you do when the alert fires?
A lag alert hands you a consumer group name and a topic. The investigation needs answers the monitoring stack doesn't hold. With the tooling Kafka ships, each answer lives in a different place:
| Question | Native tool | The catch |
|---|---|---|
| Which consumer group is lagging? | kafka-consumer-groups.sh --describe | Raw offset numbers. No timestamps, no growth rate, no history. |
| Which instance owns the stuck partition? | kafka-consumer-groups.sh --members --verbose | Same tool, different flags, different output format. You cross-reference by hand. |
| What's in the stuck messages? | kafka-console-consumer.sh | Binary garbage if the topic uses Avro. A separate tool from a separate distribution. |
| Did the schema change? | curl against Schema Registry | Two API calls, pipe to files, run diff. |
| Is the connector healthy? | curl against Connect | A "RUNNING" connector can have failed tasks buried in the response. |
| What happened an hour ago? | Nothing | The CLI shows the present. No history without a metrics stack already in place. |
Using Conduktor Console as an example, the alert links straight into the consumer group view, so your investigation starts where the alert points. No need to context switch with a CLI or terminal. The same view answers the rest of that table: schema diffs with a one-click compatibility check, connector status at the task level, and alerts routed to Slack, Teams, email, or a webhook, owned by the team that owns the group. We walk a full investigation like this one, from alert to root cause across three production incidents, in The Kafka Debugging Playbook.
Which tool should you pick?
Start from where the rest of your metrics already live, because the fastest answer is usually an extension of the stack you already operate:
- Already paying for Datadog or New Relic. Turn on their consumer-offset integrations and you get lag history and alerting today. Plan separately for the investigation side.
- On MSK. CloudWatch's per-group lag and
EstimatedMaxTimeLagare free at the default monitoring level, which covers basic alerting. Telling a stuck partition from a drifting group needs per-partition detail, and that means the paid per-partition monitoring level or an exporter. MSK also only emits lag metrics for groups in a stable or empty state with committed offsets, so check that your groups appear before you depend on the alarms. Add a UI (AKHQ, Kafbat, or Console) for the investigation side. - Open-source only. KMinion for metrics plus AKHQ or Kafbat for investigation is the standard free pairing. It's two tools by design: the exporters don't investigate, and the UIs don't alert.
- Hundreds of consumer groups and threshold fatigue. Burrow was built for exactly this. There are no per-group thresholds to tune.
- Existing Prometheus stack, but you want a deeper Kafka ops UI. Kpow adds message search, filters, and offset management on top of the Prometheus alerting you already run.
- Don't want to run two tools. Conduktor Console covers both the alerting and the investigation side: lag graphs and alerts owned by the teams that own the groups, plus message browsing and offset resets with a preview.
What is an acceptable Kafka consumer lag?
There's no universal number. Steady lag that drains is healthy. Lag that grows and never drains is a problem, whatever the number. Alert on the trend rather than a fixed count, and set thresholds per topic.
How do I check Kafka consumer lag?
Run kafka-consumer-groups.sh --describe --group . It prints current offset, log-end offset, and lag per partition. For continuous monitoring, use a tool that stores history: an exporter with Prometheus, your observability platform, or a Kafka platform with lag graphs built in.
Is offset lag or time lag more useful?
Offset lag counts messages behind. Time lag converts that to seconds, which is easier to act on: 45 seconds behind means the same thing on every topic, while 10,000 messages does not. Every time-lag figure is an estimate, so check how your tool computes it.
Does high consumer lag mean my consumer is slow?
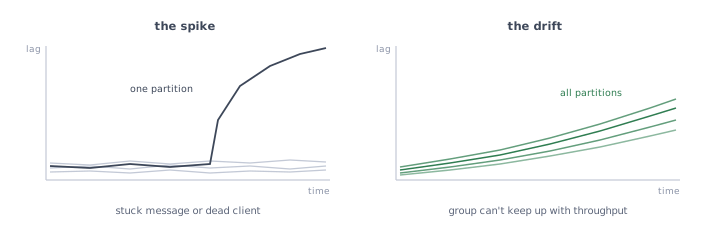
Not necessarily. Lag on one partition, with the rest healthy, usually means a stuck message or a dead consumer instance. Lag rising across all partitions means the group can't keep up with throughput. Per-partition lag tells the two apart.
Related: Kafka Consumer Lag Monitoring → · Consumer Lag Alerting Thresholds → · The Kafka Debugging Playbook →