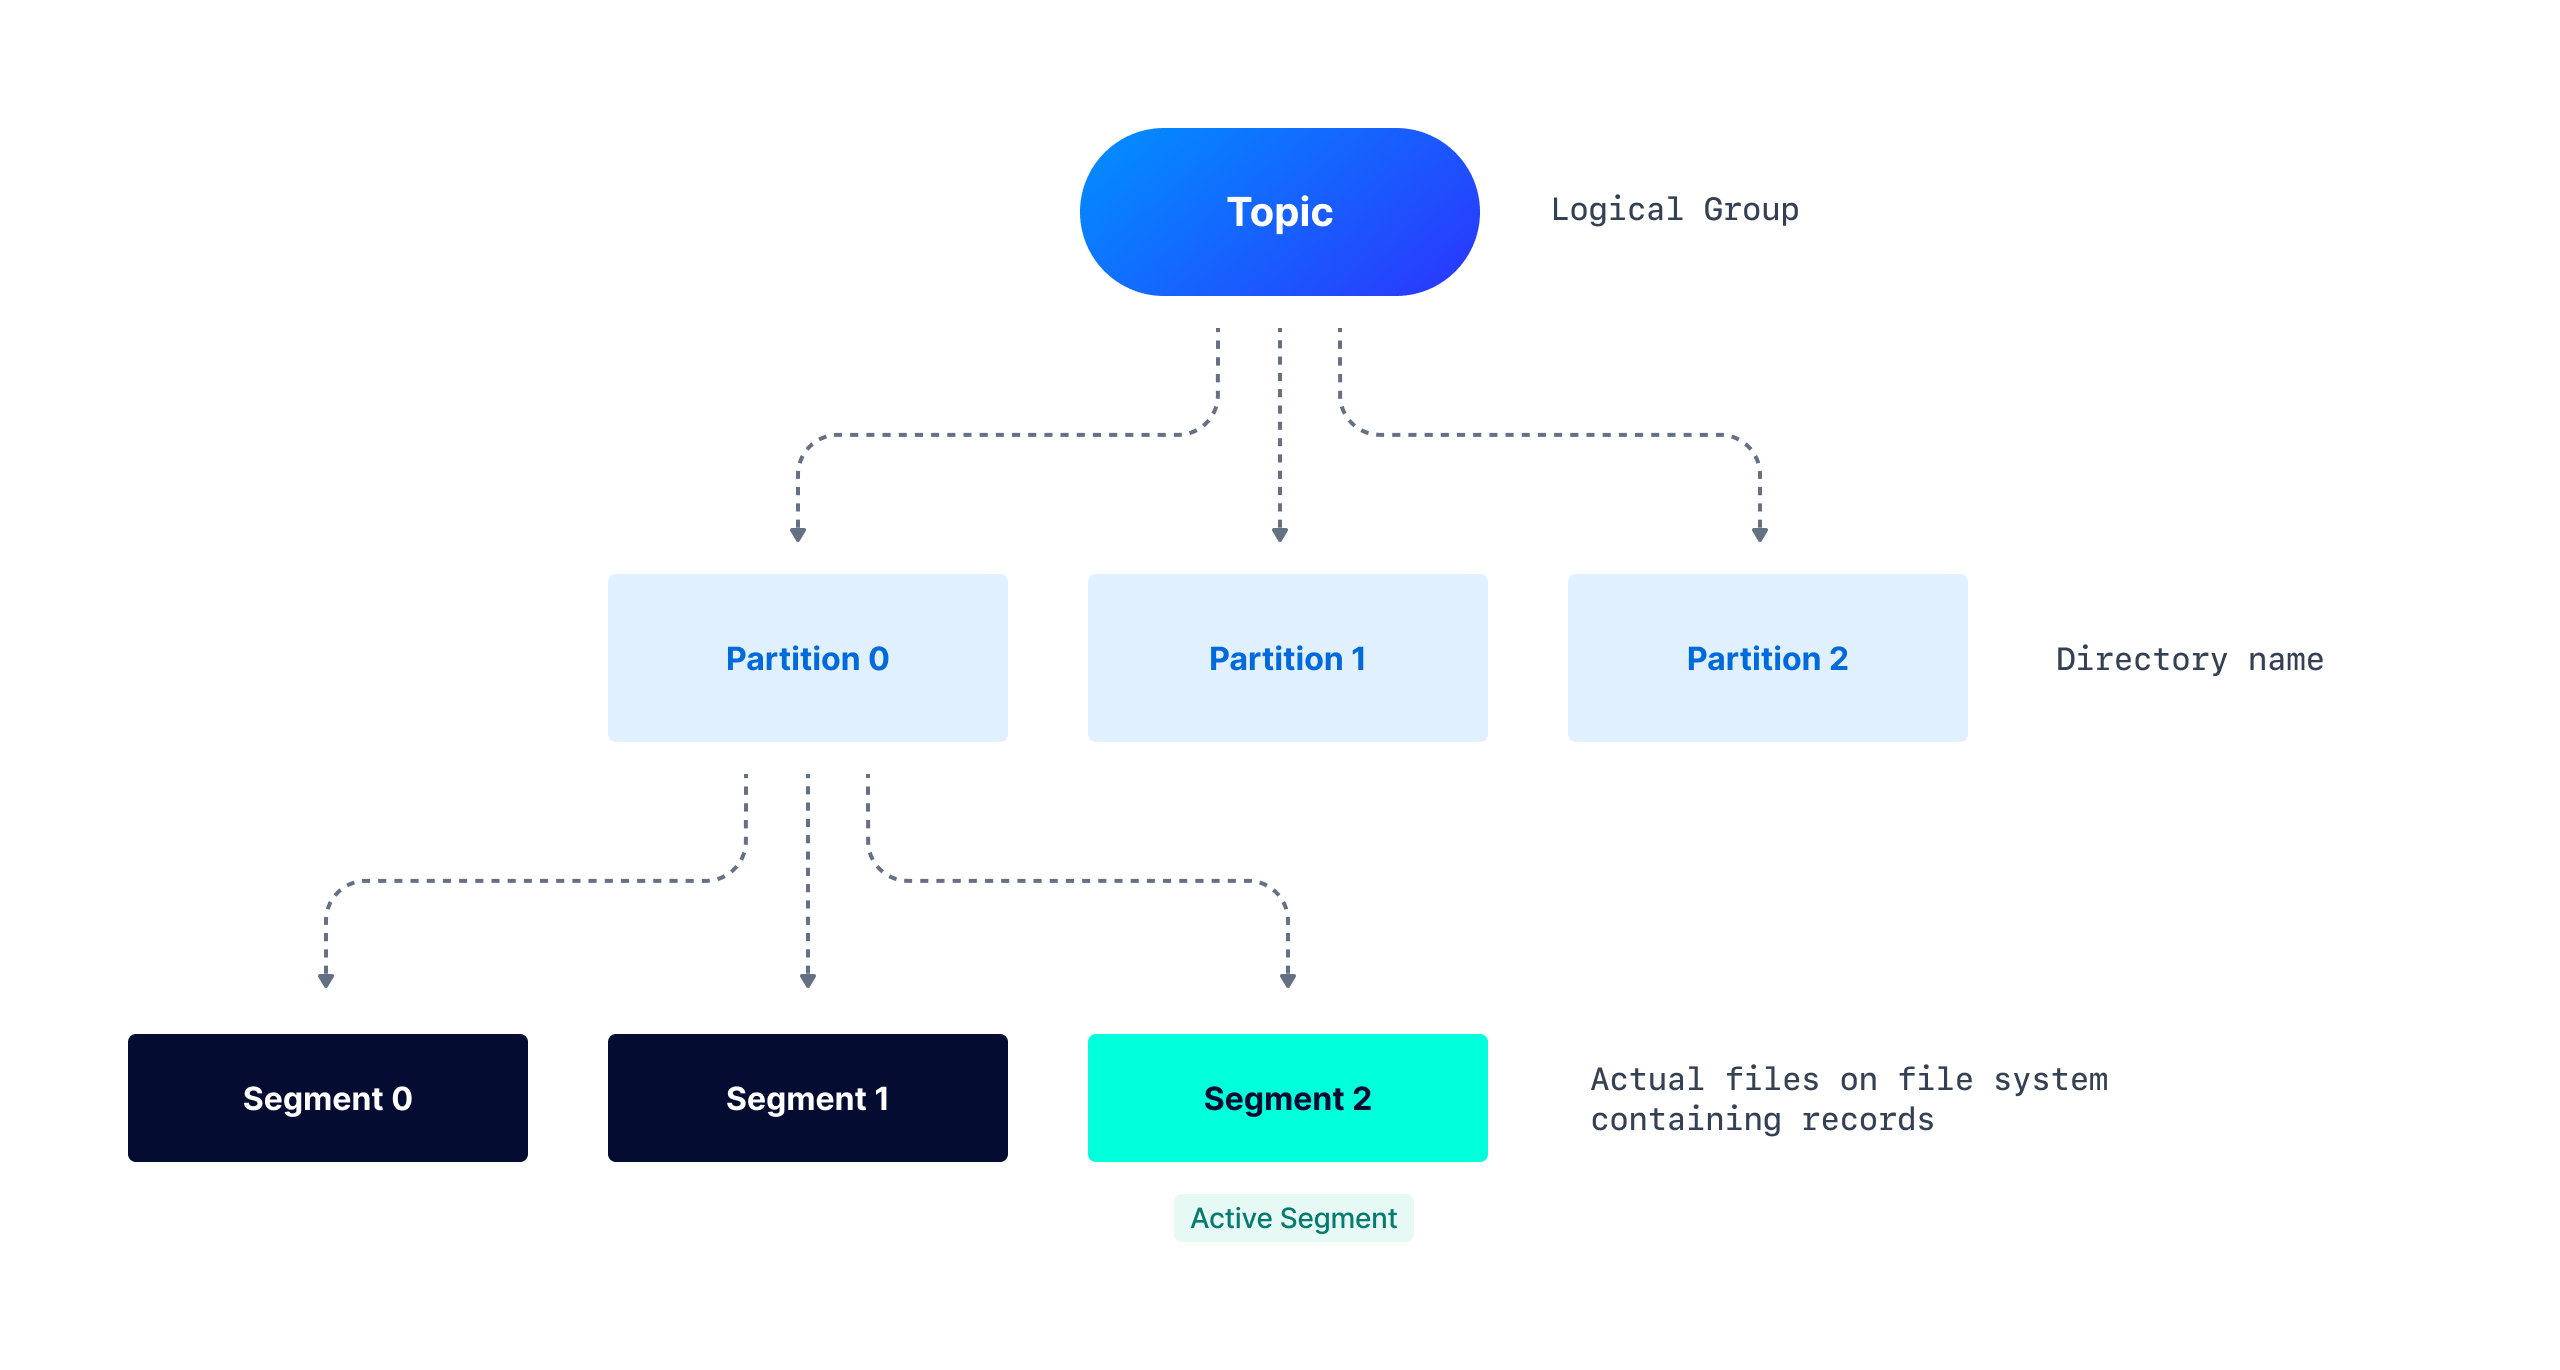
Apache Kafka is a commit-log system. The records are appended at the end of each Partition, and each Partition is also split into segments. Segments help delete older records through Compaction, improve performance, and much more. We can see the relation in the below diagram:

Kafka allows us to optimize the log-related configurations, we can control the rolling of segments, log retention, etc. These configurations determine how long the record will be stored and we’ll see how it impacts the broker's performance, especially when the cleanup policy is set to Delete.
Partition Structure on file-system
As discussed in the above diagram, Kafka Topic is divided into Partitions. A partition is a logical unit of work in Kafka where records get appended but it is not the unit of storage. Partitions are further split into Segments which are the actual files on the file system. For better performance and maintainability, multiple segments get created, and rather than reading from one huge Partition, Consumers can now read faster from a smaller segment file. A directory with the partition name gets created and maintains all the segments for that partition as various files.
Here is a sample directory structure for Topic my-topic and its partition my-topic-0.
|── my-topic-0
   ├── 00000000000000000000.index
   ├── 00000000000000000000.log
   ├── 00000000000000000000.timeindex
   ├── 00000000000000001007.index
   ├── 00000000000000001007.log
   ├── 00000000000000001007.snapshot
   ├── 00000000000000001007.timeindex
   ├── leader-epoch-checkpoint
.log file - This file contains the actual records and maintains the records up to a specific offset. The name of the file depicts the starting offset added to this file.
.index file - This file has an index that maps a record offset to the byte offset of the record within the
.log file. This mapping is used to read the record from any specific offset.
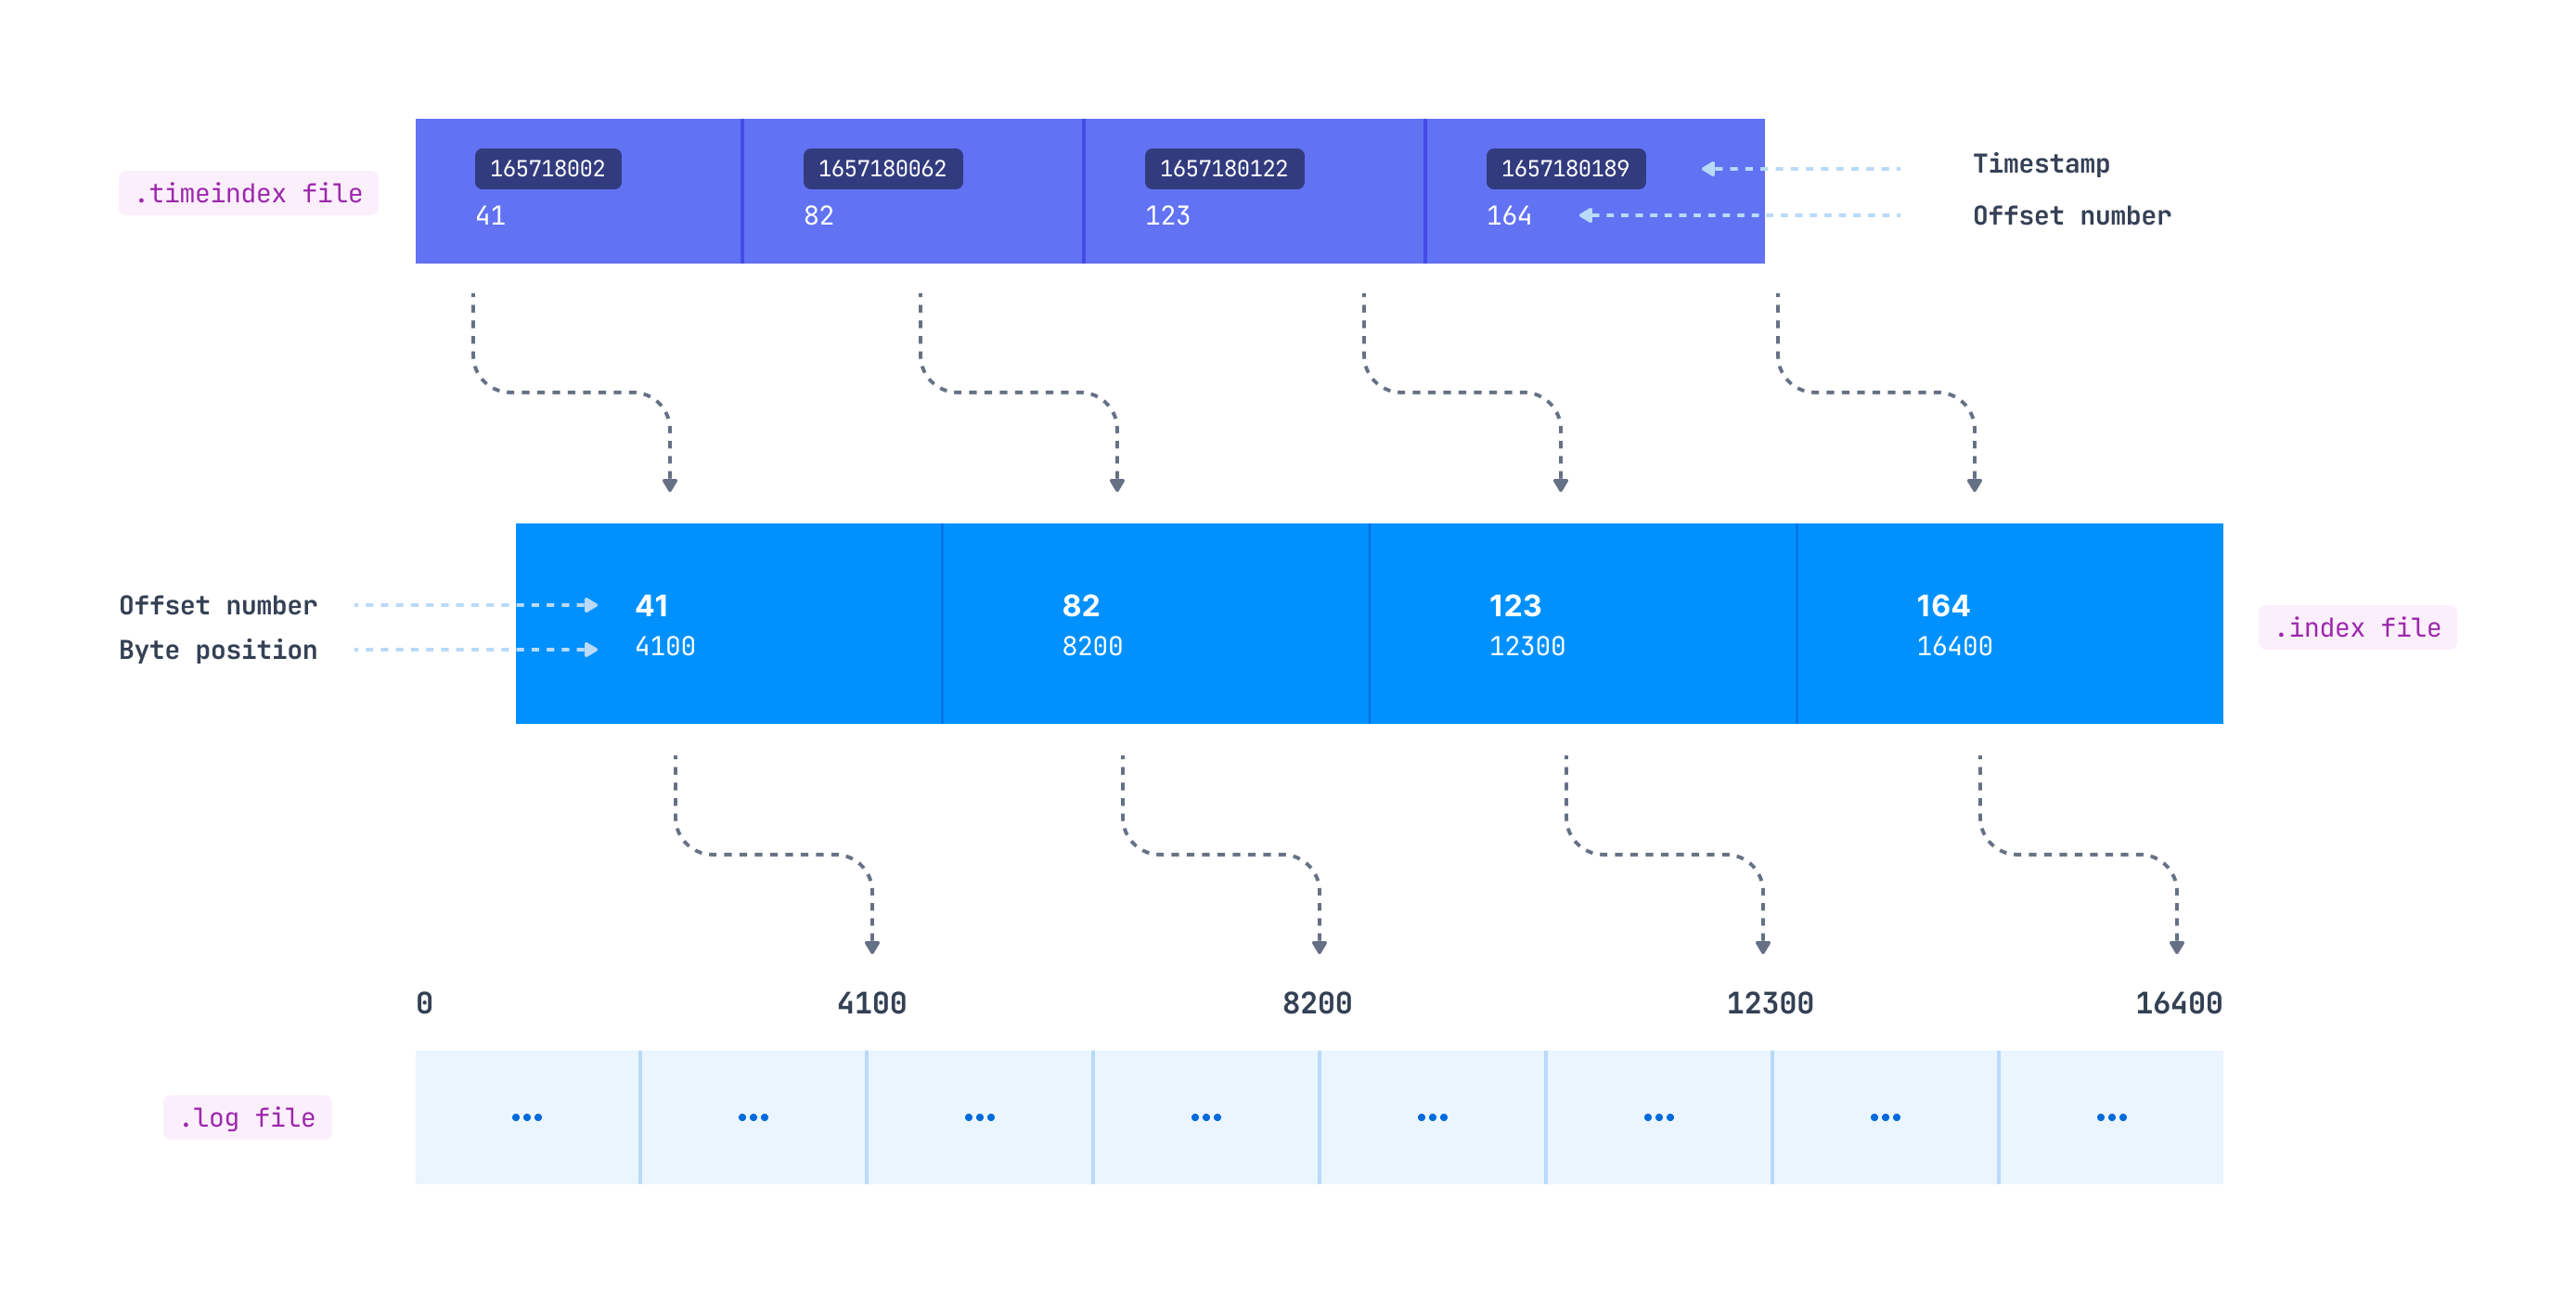
.timeindex file - This file contains the mapping of the timestamp to record offset, which internally maps to the byte offset of the record usingthe
.index file. This helps in accessing the records from the specific timestamp.
.snapshot file - contains a snapshot of the producer state regarding sequence IDs used to avoid duplicate records. It is used when, after a new leader is elected, the preferred one comes back and needs such a state to become a leader again. This is only available for the active segment (log file).
leader-epoch-checkpoint - It refers to the number of leaders previously assigned by the controller. The replicas use the leader epoch as a means of verifying the current leader. The leader-epoch-checkpoint file contains two columns: epochs and offsets. Each row is a checkpoint for the latest recorded leader epoch and the leader's latest offset upon becoming leader
From the structure, we could see that the first log segment 00000000000000000000.log contains the records from offset 0 to offset 1006. The next segment 00000000000000001007.log has the records starting from offset 1007, and this is called the active segment.

The active segment is the only file available for reading and writing while consumers can use other log segments (non-active) to read data. When the active segment becomes full (configured by log.segment.bytes, default 1 GB) or the configured time (log.roll.hours or log.roll.ms, default 7 days) passes, the segment gets rolled. This means that the active segment gets closed and re-opens with read-only mode and a new segment file (active segment) will be created in read-write mode.
Role of Indexing within the Partition
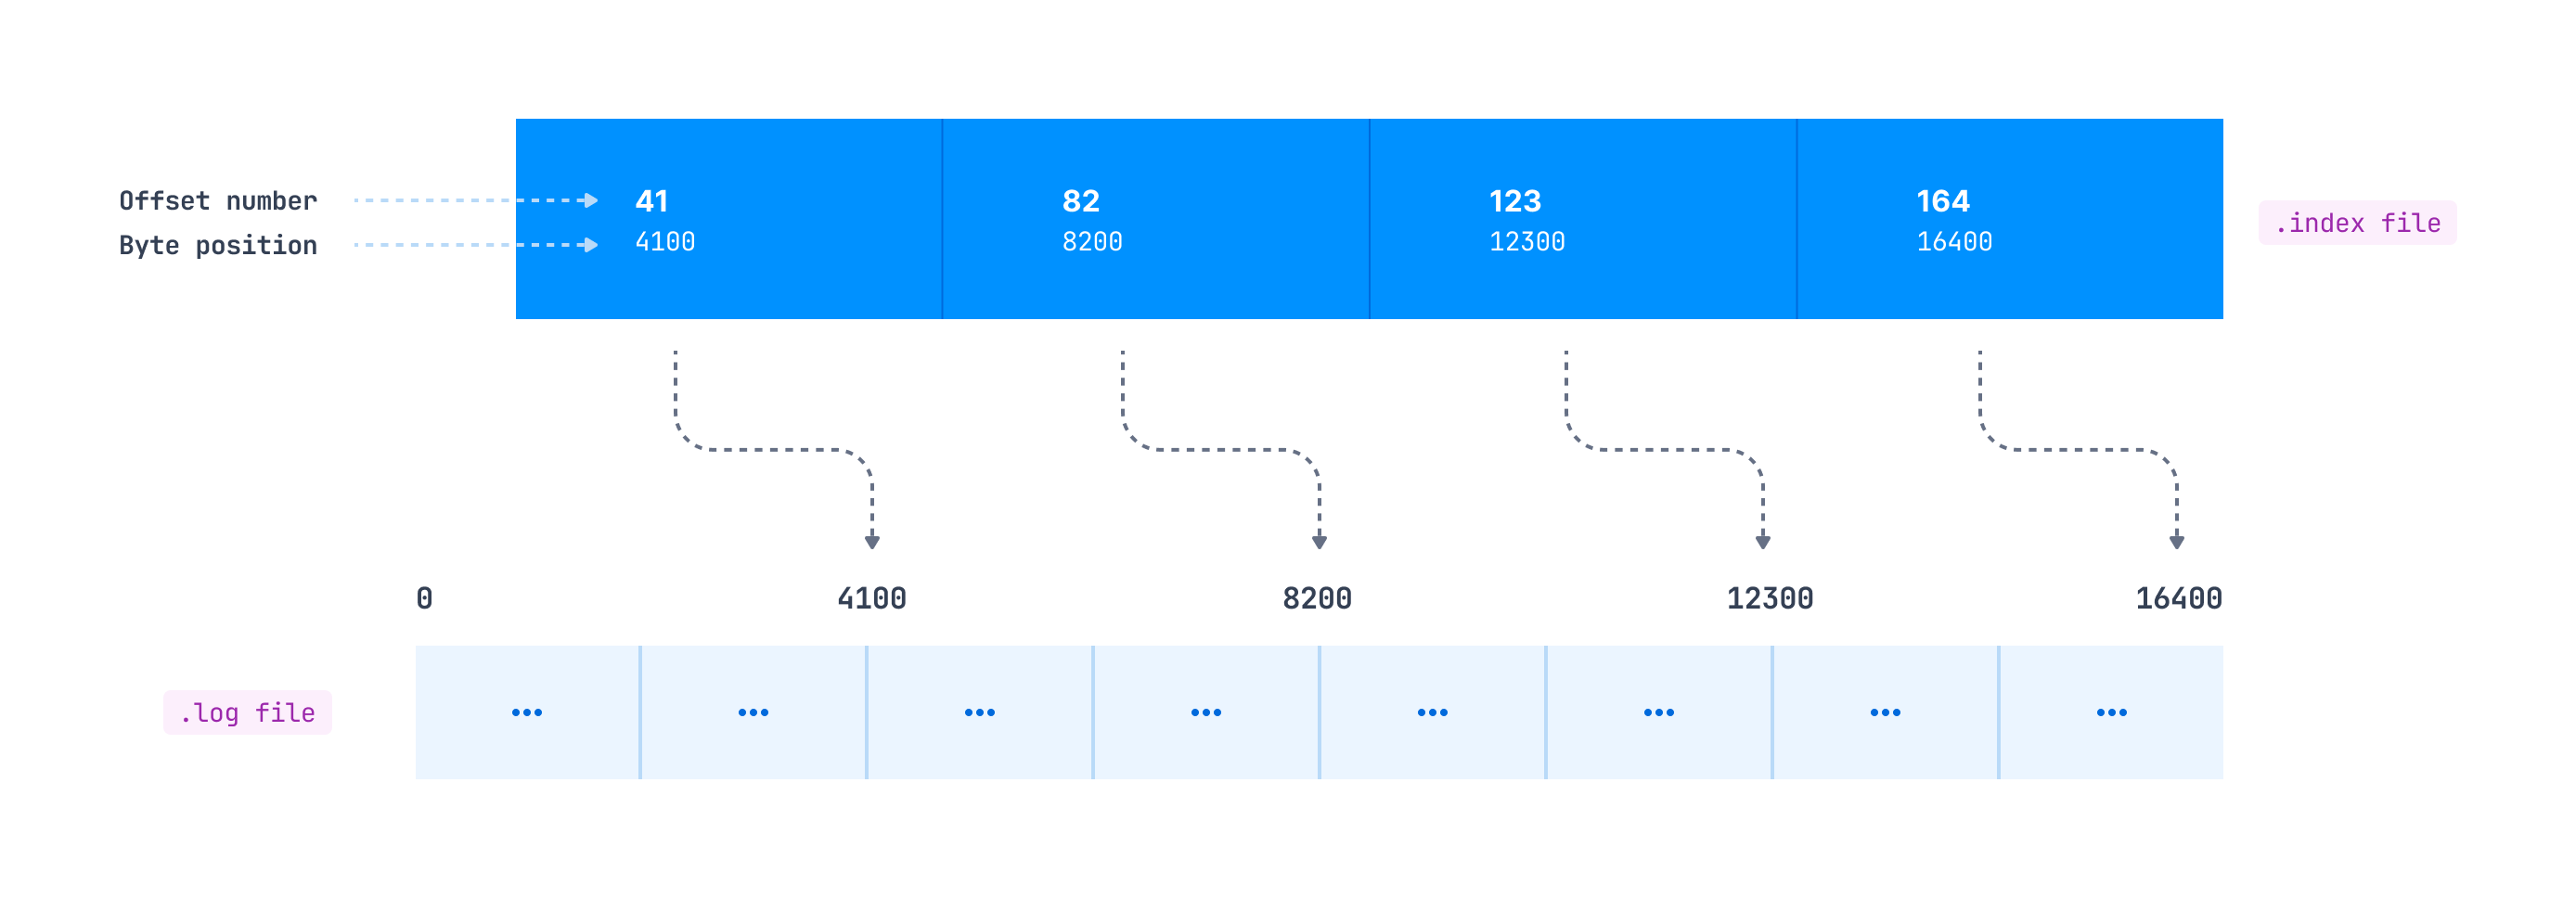
Indexing helps consumers to read data starting from any specific offset or using any time range. As mentioned previously, the .index file contains an index that maps the logical offset to the byte offset of the record within the .log file. You might expect that this mapping is available for each record, but it doesn’t work this way.
How these entries are added inside the index file is defined by the log.index.interval.bytes parameter, which is 4096 bytes by default. This means that after every 4096 bytes added to the log, an entry gets added to the index file. Suppose the producer is sending records of 100 bytes each to a Kafka topic. In this case, a new index entry will be added to the .index file after every 41 records (41*100 = 4100 bytes) appended to the log file.

As we can see in the above diagram, the offset with id 41 is at 4100 bytes in the log file, offset 82 is at 8200 bytes in the log file, and so on.
If a consumer wants to read starting at a specific offset, a search for the record is made as follows:
Search for the .index file based on its name. For e.g. If the offset is 1191, the index file will be searched whose name has a value less than 1191. The naming convention for the index file is the same as that of the log file
Search for an entry in the .index file where the requested offset falls.
Use the mapped byte offset to access the .log file and start consuming the records from that byte offset.
As we mentioned, consumers may also want to read the records from a specific timestamp. This is where the .timeindex file comes into the picture. It maintains a timestamp and offset mapping (which maps to the corresponding entry in the .index file), which maps to the actual byte offset in the .log file.

Rolling segments
As discussed in the above sections, the active segment gets rolled once any of these conditions are met-
Maximum segment size - configured by log.segment.bytes, defaults to 1 Gb
Rolling segment time - configured by log.roll.ms and log.roll.hours, defaults to 7 days
Index/timeindex is full - The index and timeindex share the same maximum size, which is defined by the log.index.size.max.bytes, defaults to 10 MB
The 3rd condition is not well known but it also impacts the segment rolling. We know that because log.index.interval.bytes is 4096 bytes by default, an entry is added in the index every 4096 bytes of records. It means that for a 1 GiB segment size, 1 GiB / 4096 bytes = 262144 entries are added to the index. One entry in the index file takes 8 bytes so this equals 2 MB of the index (262144 * 8 bytes). The default index size of 10 MB is enough to handle a segment size of 5 GiB.
By increasing the segment size over 5 GiB, you would also need to increase the index file size as well. Likewise, if you decide to reduce the index file size, it is possible that you might want to decrease the segment size accordingly.
The timeindex might also need attention. Because each timeindex entry is 1.5x bigger than an entry in the index (12 bytes versus 8 bytes), it can fill up earlier and cause a new segment to be rolled. For the same example as above, for 1 GiB segment size, the timeindex file will take 262144 * 12 = 3 MB.
Impact of increasing/decreasing the segment size
Generally you don’t want to increase/decrease the log.segment.bytes and keep it as default. But let’s discuss the impact of changing this value so that you can make an informed decision if there’s a need.
Decrease this size for better compaction
- You have the deletion policy as compact(Compaction is a separate topic which will be covered later)
and the data coming to the topic is not very fast, so it may take a lot of time to compact the partition as compaction occurs only when the segment gets closed. Now, if the Producer is not sending a lot of data and the segment is not filling, it would be better to decrease log.segment.bytes to compact the partition effectively.
Increase the size if you have more partitions to host on a single broker
- When a Producer produces the records, it gets appended to the active segment and the consumer can read records from any segment. The broker can host many partitions and there could be so many open files to produce and read data from.
The maximum open files (nofile) limit has a default value of 1024 on some versions of Linux. You might have encountered the “Too many open files” issue while working with Kafka and this is the reason for that. You can increase the value of nofile to the appropriate number and Kafka recommends this to be 100000. But in scenarios where you have a lot of partitions hosted on a single broker, you can keep within this limit by increasing the log.segment.bytes to a higher number (within the limit of the system’s RAM). Having a higher segment size decrease the number of segments (files), which will eventually decrease the number of open files.
Log retention - The records may persist longer than the retention time
Kafka, with its feature of retaining the log for a longer duration rather than deleting it like traditional messaging queues once consumed, provides many added advantages. Multiple consumers can read the same data, apart from reading the data it can also be sent to data warehouses for further analytics.
How long is the data retained in Kafka? This is configurable using the maximum number of bytes to retain by using the log.retention.bytes parameter. If you want to set a retention period, you can use the log.retention.ms, log.retention.minutes, or log.retention.hours (7 days by default) parameters.
Suppose you configure the topic by specifying a retention time of 600000 ms (10 mins) and a segment size of 16384 bytes, the expectation would be to roll the segment once its size reaches 16 Kb but this is the max size if the record to be inserted is of more size than available in the active segment, the segment will be rolled and the record will get saved in the new segment.
Regarding the log retention, the expectation would be that the record will be persisted for 10 mins and after that, it should get deleted. A segment, together with the records it contains, can be deleted only when it is closed. So the following things may impact when the records get deleted-
If the producer is slow and the maximum size of 16 Kb is not reached within
10 minutes, older records won’t be deleted. In this case, the log retention would be higher than 10 mins.
If the active segment is filled quickly, it will be closed but only get deleted once the last inserted record persists for 10 mins. So in this case as well, the latest inserted record would be persisted for more than 10 mins. - Suppose the segment is getting filled in 7 mins and getting closed, the last inserted record will stay for 10 mins so the actual retention time for the first record inserted into the segment would be 17 mins.
The log can be persisted for an even longer duration than the last added record in the segment. How? Because the thread which gets executed and checks which log segments need to be deleted runs every 5 mins. This is configurable using
log.retention.check.interval.ms configurations. - Depending on the last added record to the segment, this cleanup thread can miss the 10 min retention deadline. So in our example above instead of persisting the segment for 17 mins, it could be persisted for 22 mins.
Do you think that this would be the maximum time the record is persisted in Kafka? No, the cleaner thread checks and just marks the segment to be deleted. The
log.segment.delete.delay.ms broker parameter defines when the file will actually be removed from the file system when it’s marked as “deleted” (default, 1 min) - Going back to our example the log is still available even after 23 mins, which is way longer than the retention time of 10 mins.
So The usual retention limits are set by using log.retention.ms defines a kind of minimum time the record will be persisted in the file system.
Consumers get records from closed segments but not from deleted ones, even if they are just marked as “deleted” but not actually removed from the file system.
Note: I have described a single record getting appended to the segment for simplicity and to let you understand the concept clearly but in actuality multiple records (record batch) get appended to the segment file.
Conclusion
As discussed in this blog, configuration parameters can have a surprisingly big influence on how long your data is retained. Understanding these parameters and how you can adjust them gives you a lot more control over how you handle your data. Let’s summarize what parameters we have discussed here-
Parameter Name | Default value | Can be set at? | Impact |
log.segment.bytes | 1 GiB | Broker/Topic level( segment.bytes ) | The maximum size of a single log file (segment) |
log.roll.hours/ log.roll.ms | 168(hours)/null | Broker/Topic level( segment.ms ) | The maximum time before a new log segment is rolled out |
log.index.interval.bytes | 4096 bytes | Broker/Topic level( index.interval.bytes ) | The interval with which we add an entry to the index file |
log.index.size.max.bytes | 0485760 (10 mebibytes) | Broker/Topic level( segment.index.bytes ) | The maximum size in bytes of the offset index |
log.retention.bytes | -1 (means never delete) | Broker/Topic level( retention.bytes ) | The maximum size of the log before deleting it |
log.retention.ms/ log.retention.minutes/ log.retention.hours | null//null/168(hours) | Broker/Topic level( retention.ms ) | The time to keep a log file before deleting it |
log.retention.check.interval.ms | 300000 (5 minutes) | Broker level | The frequency in milliseconds that the log cleaner checks whether any log is eligible for deletion |
log.segment.delete.delay.ms | 60000 (1 minute) | Broker/Topic level( file.delete.delay.ms ) | The amount of time to wait before deleting a file from the filesystem |
We aim to accelerate Kafka projects delivery by making developers and organizations more efficient with Kafka.
