We've covered the Conduktor Console, which gives you a powerful user interface for Apache Kafka, and Testing, allowing you to test anything you build. But once you've got Kafka applications into production, how do you ensure that everything remains stable and functional? Developers rely on monitoring and alerting software to keep them up to date and aware of problems with applications. There are plenty of very good monitoring solutions already available and widely used, but none have been designed for Apache Kafka. That's why we built Conduktor Monitoring and Alerting.
Pitfalls of Existing Monitoring Solutions
There are some monitoring solutions that work with Kafka. Many development teams will make use of open-source tools like Grafana or Prometheus, and there are paid solutions. All have their own strengths and weaknesses, but the crucial issue is that they were not designed with Kafka in mind.
There are more than 20,000 metrics you could keep track of in Kafka. Picking out the ones that matter requires real expertise and none of the general-purpose monitoring options can offer any help.
Monitoring needs to take place both over your Kafka system, keeping track of things like cluster health & broker status; and it is needed for Kafka applications, observing how an application behaves, whether it is consuming or producing messages, what its throughput is, and so on.
Assuming that you can solve these problems, building this monitoring to cover everything will take a huge amount of resources, whether time or money. It's a potentially major investment with no guarantee that the final product will be monitoring the metrics you want and need.
Conduktor Monitoring solves these problems.
What Conduktor Monitoring & Alerting can bring
Conduktor is filled with Kafka experts who know the ins and outs of the system. There are few companies better placed to work out what Kafka metrics are important, and we have designed a system that focuses on what really matters. The metrics that are highlighted in our monitoring dashboards and in alerts are the ones that make a difference. We are an opinionated Monitoring provider.
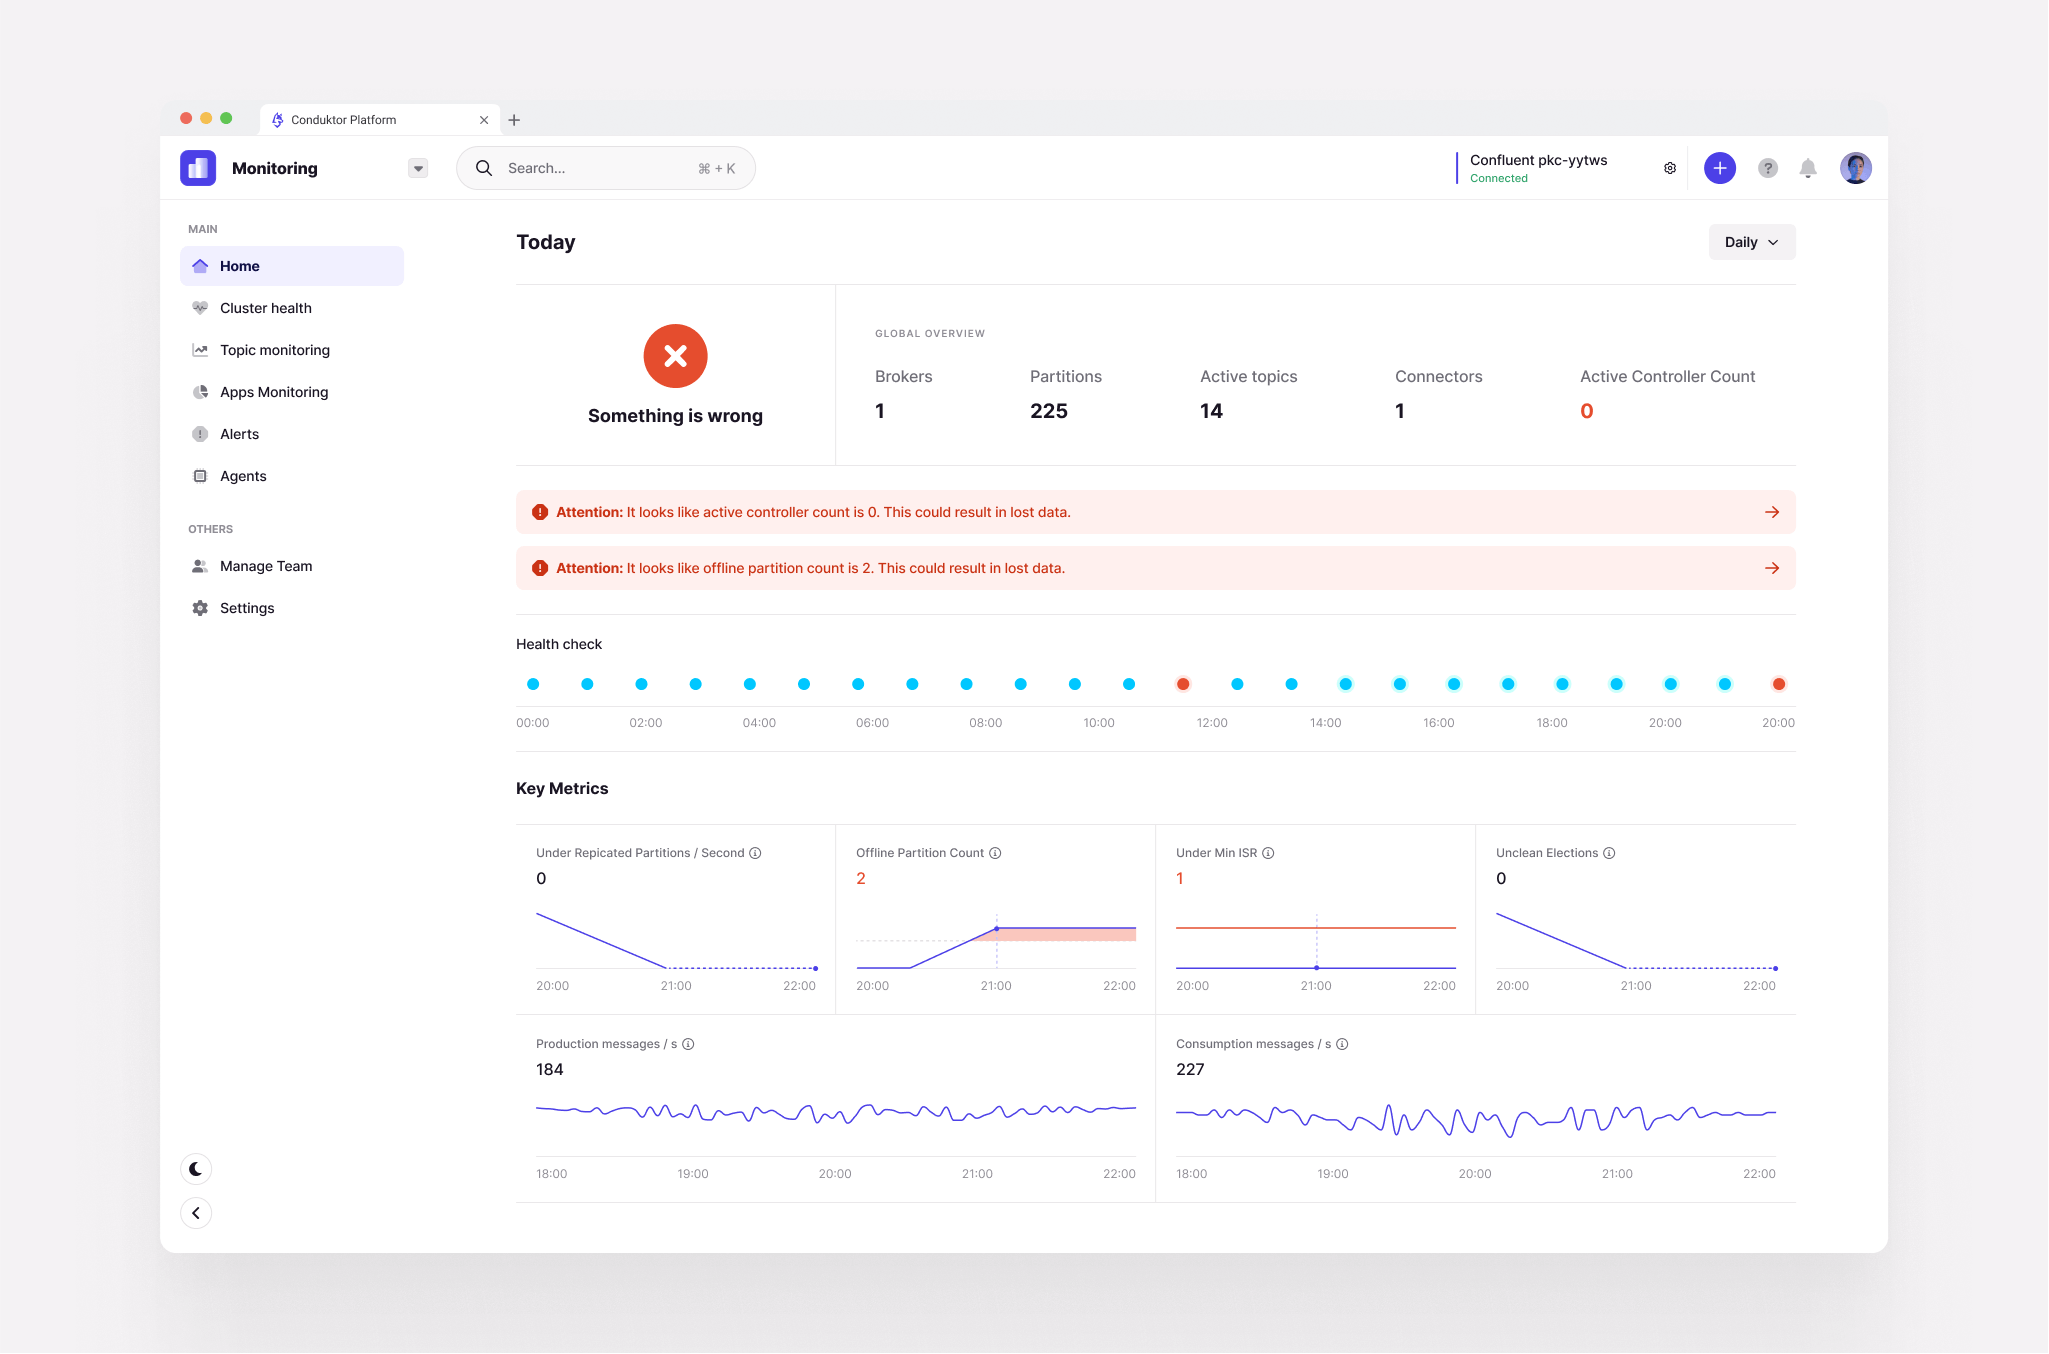
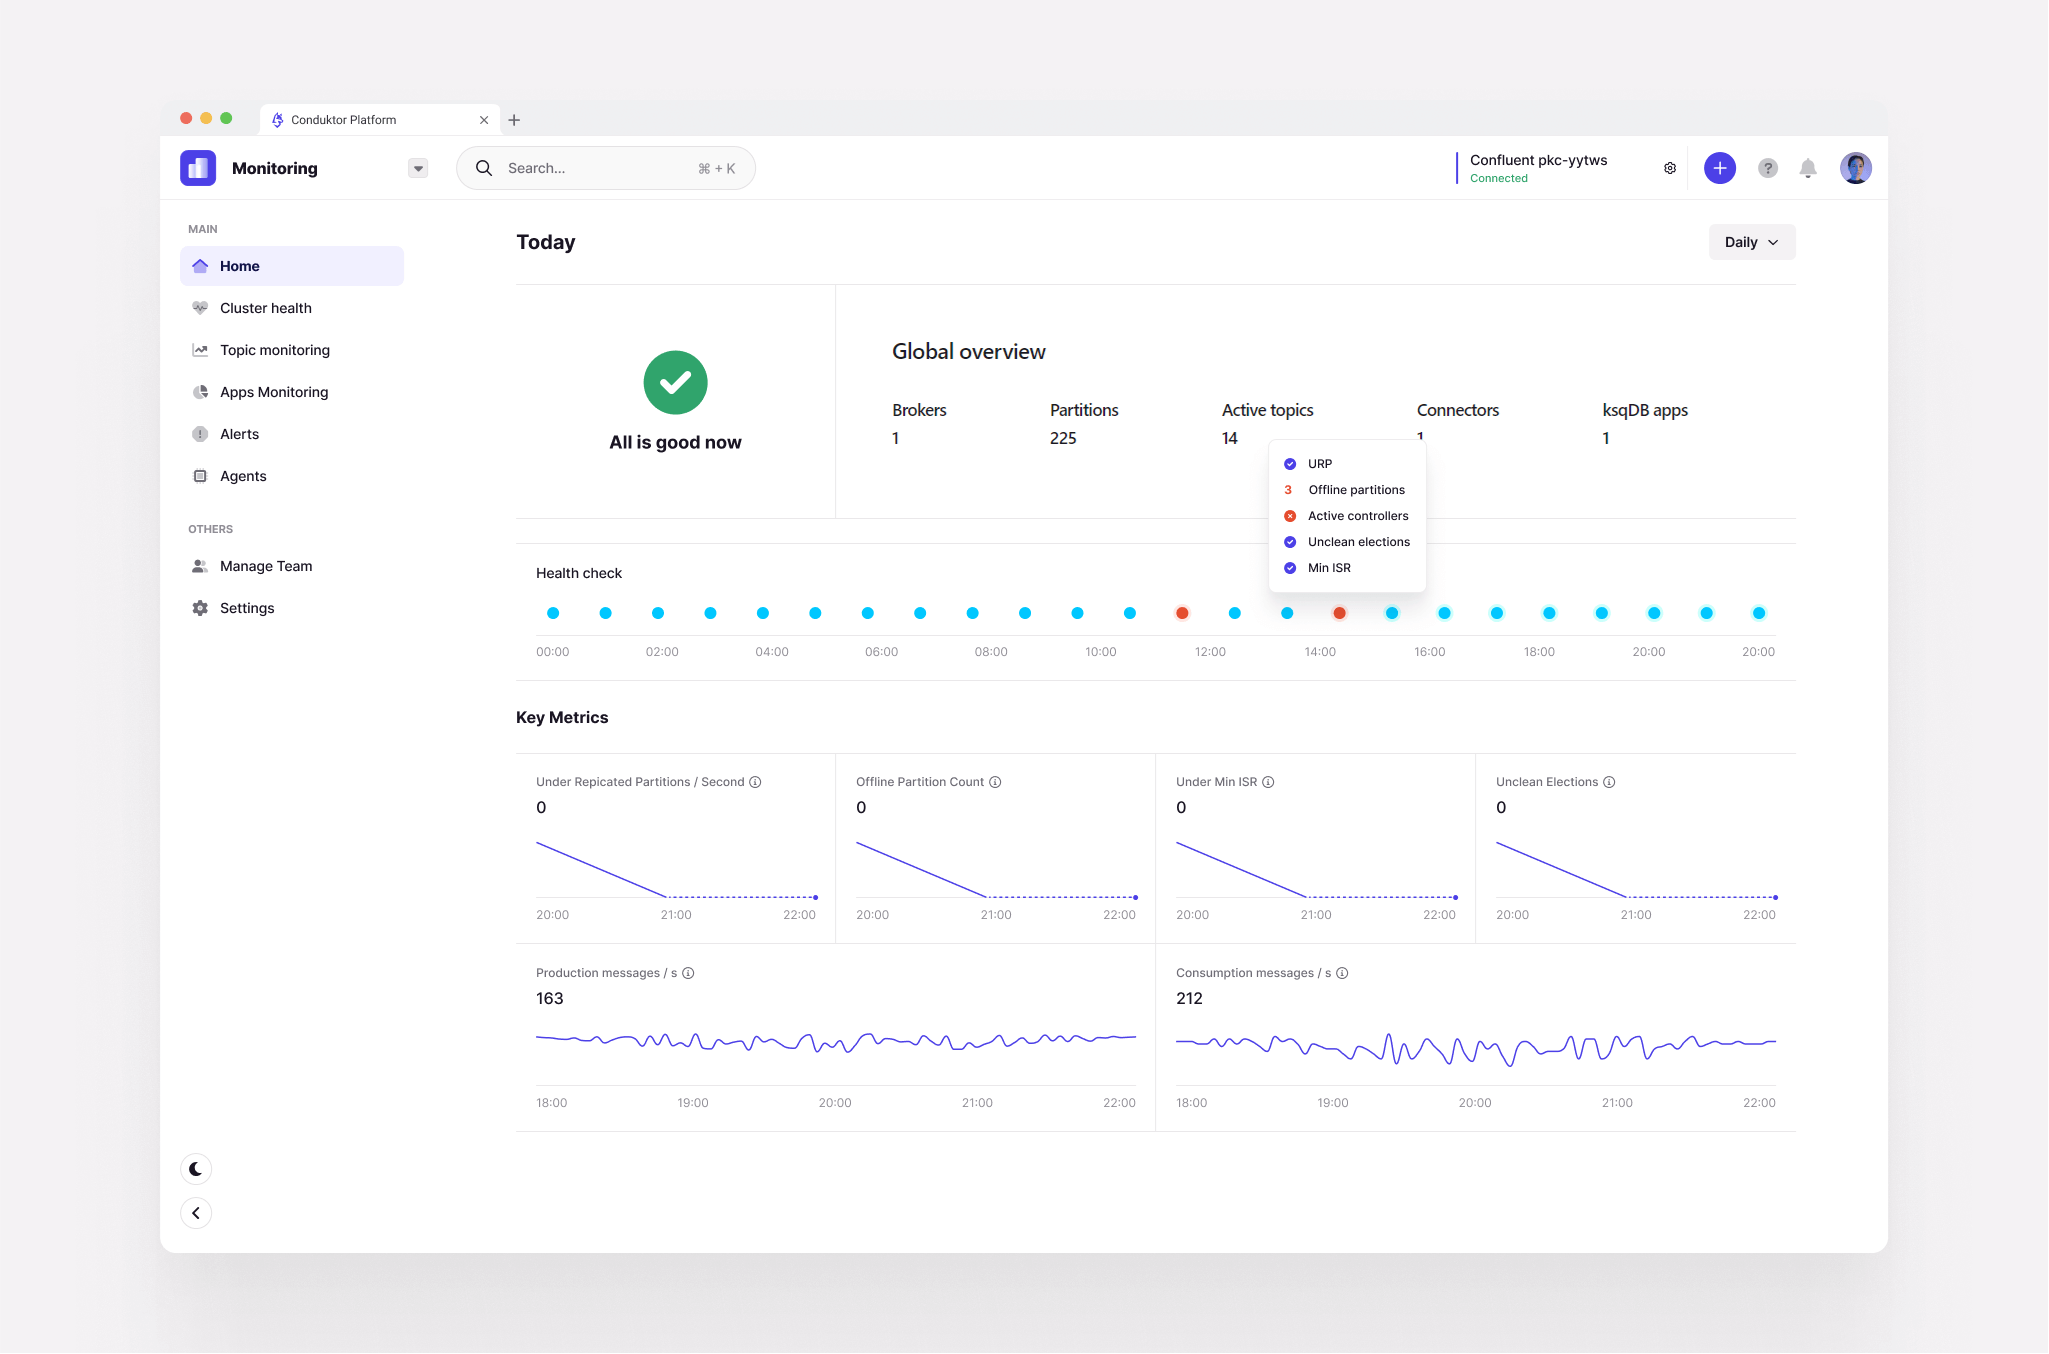
Dashboarding requires no setup. As soon as you add a topic and start producing or consuming data, Conduktor Monitoring can be active, tracking metrics. Integrations with other centralized monitoring solutions are available out-of-the-box, enabling users to instantly connect Kafka monitoring to the rest of their dashboards, instead of spending weeks building their own.
There are 3 main areas that are needed for monitoring and which are key to Conduktor Monitoring - cluster health, topic monitoring, and app monitoring. Existing Kafka monitoring focuses on Kafka itself, not really on the applications connected to Kafka. despite their importance.
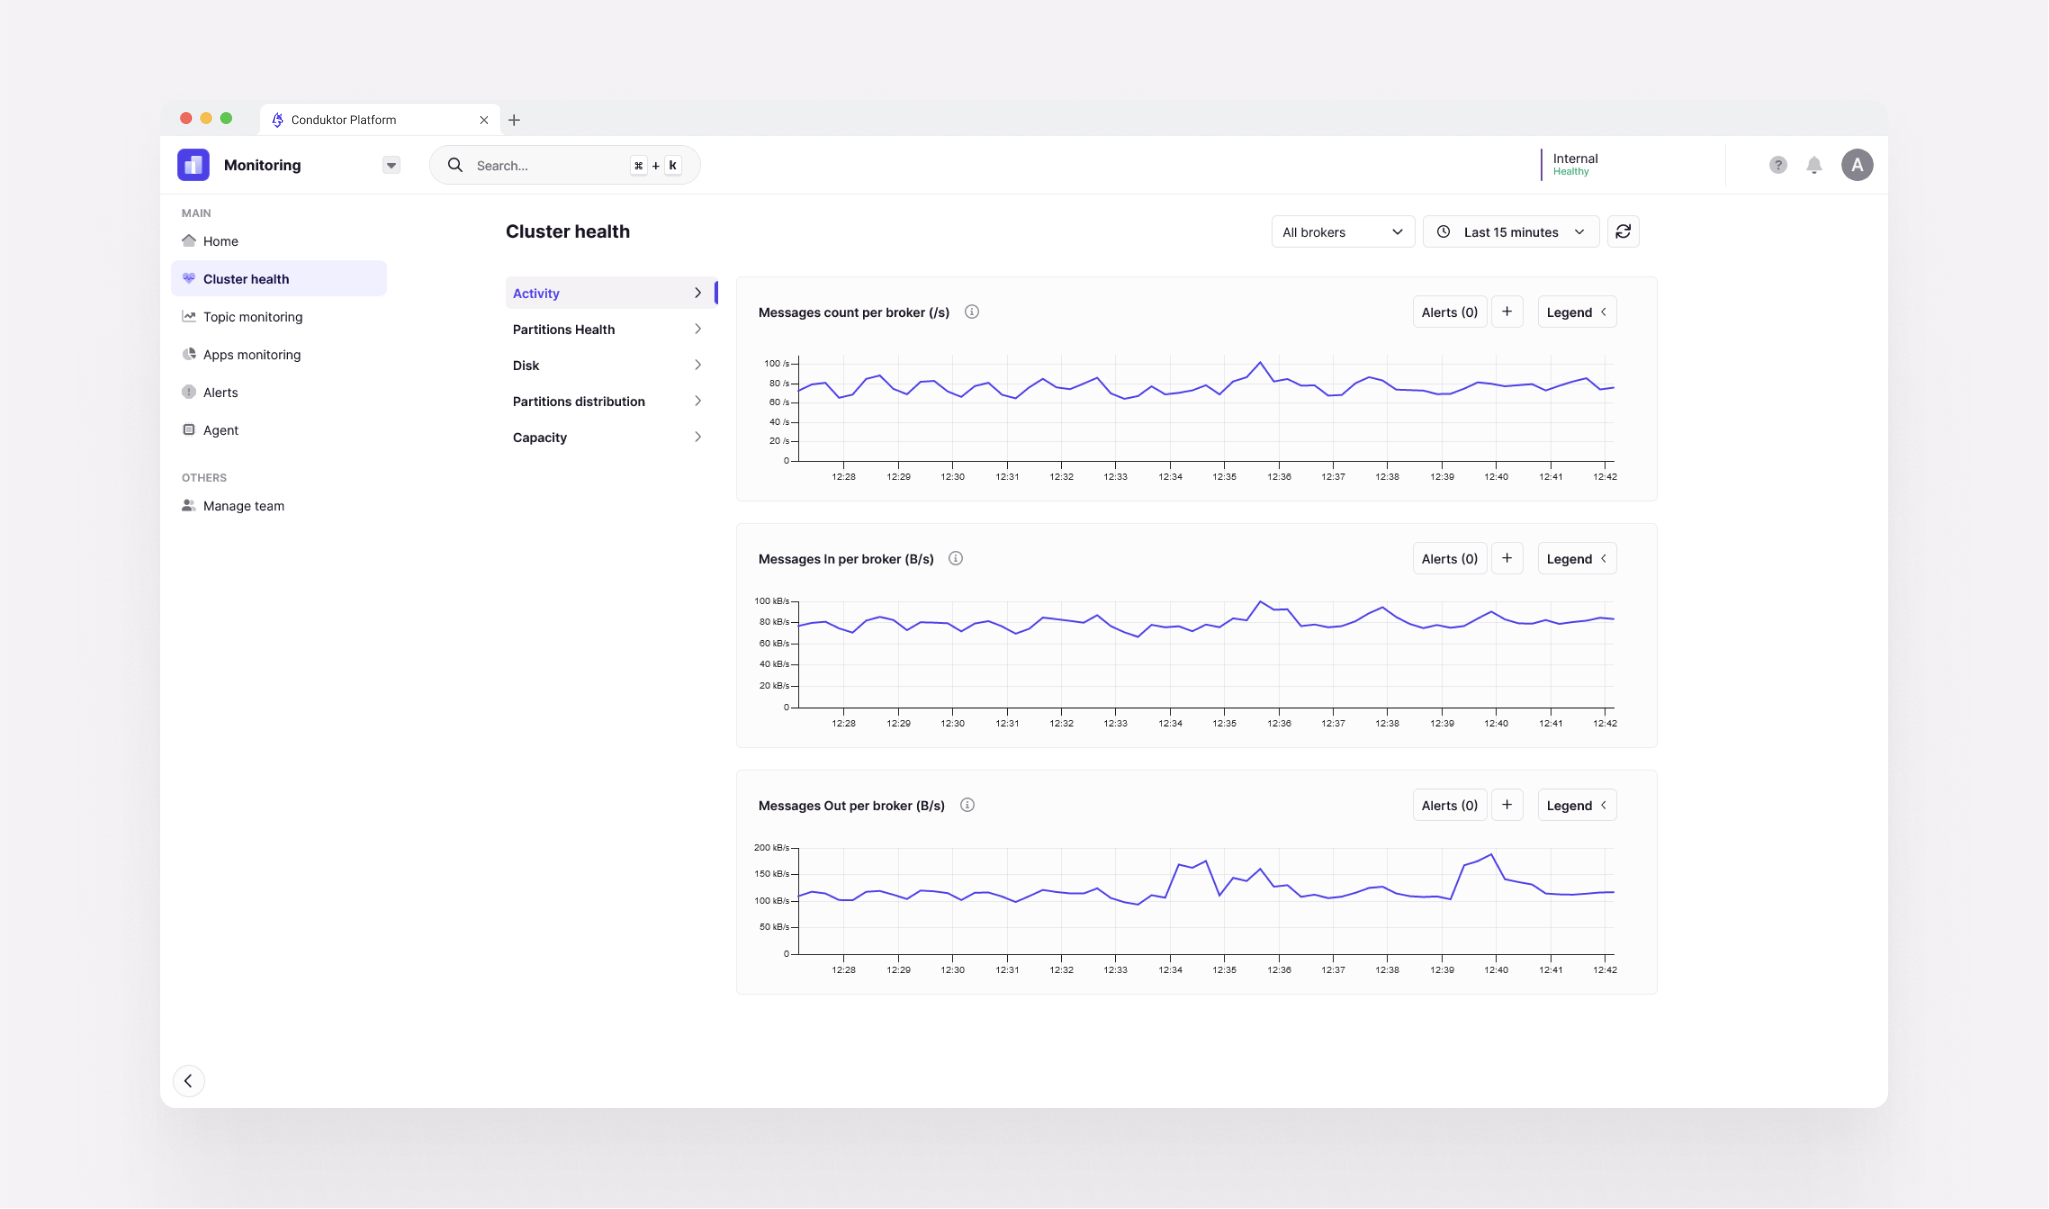
Cluster health looks at metrics like active brokers, active partitions, and active controller accounts. It also collects cap usage as well as top connections over time.
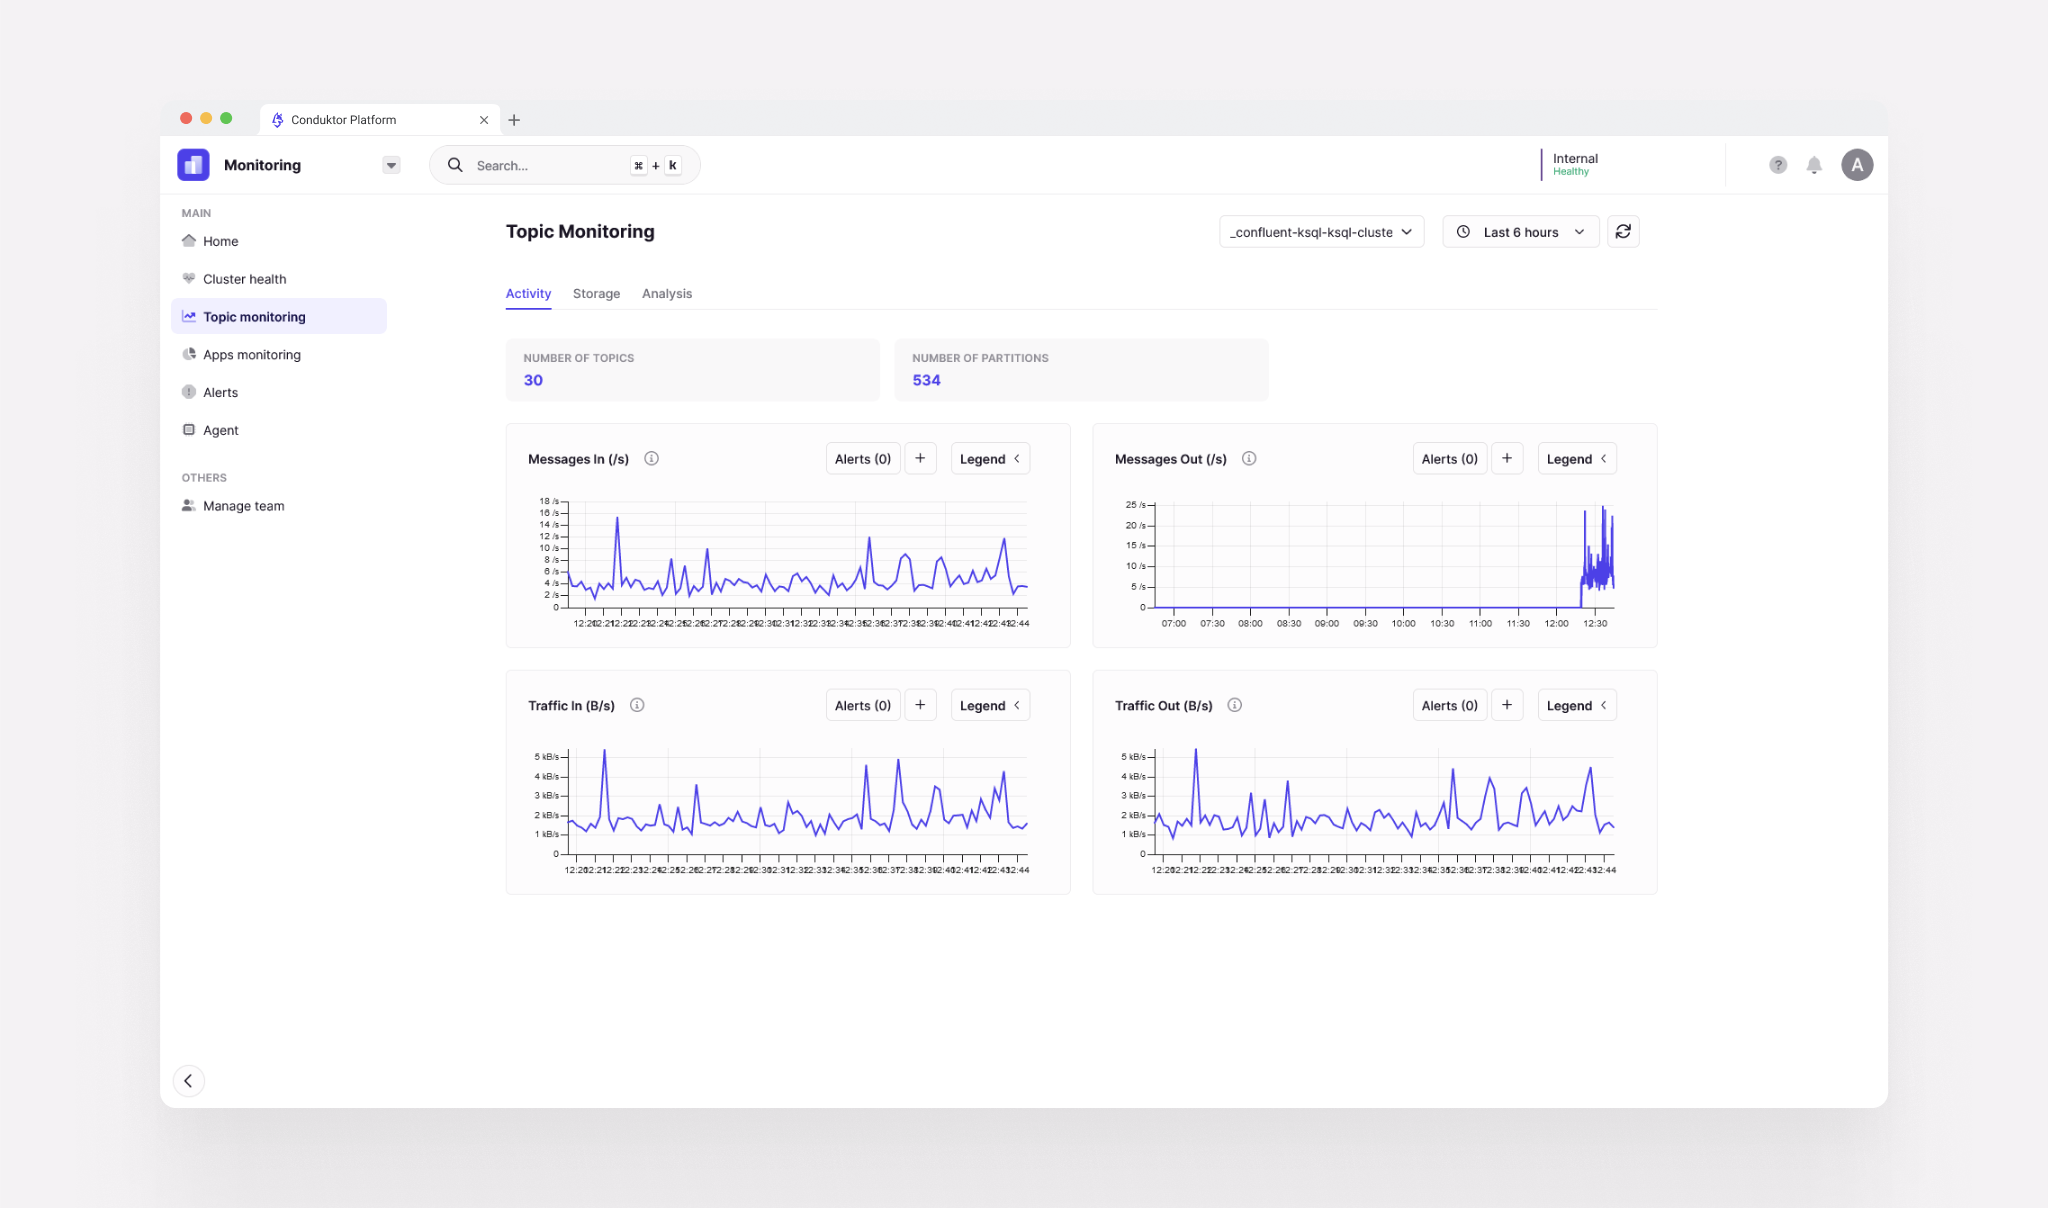
Topic monitoring looks at the obvious: messages in, messages out; bits and bytes out; how much data you're storing on your topic. And we can break this down by topic or partition. So if you have a really big partition and you want to diagnose why it's always lagging, you can. It also shows you duplicates and distinct duplicate accounts.
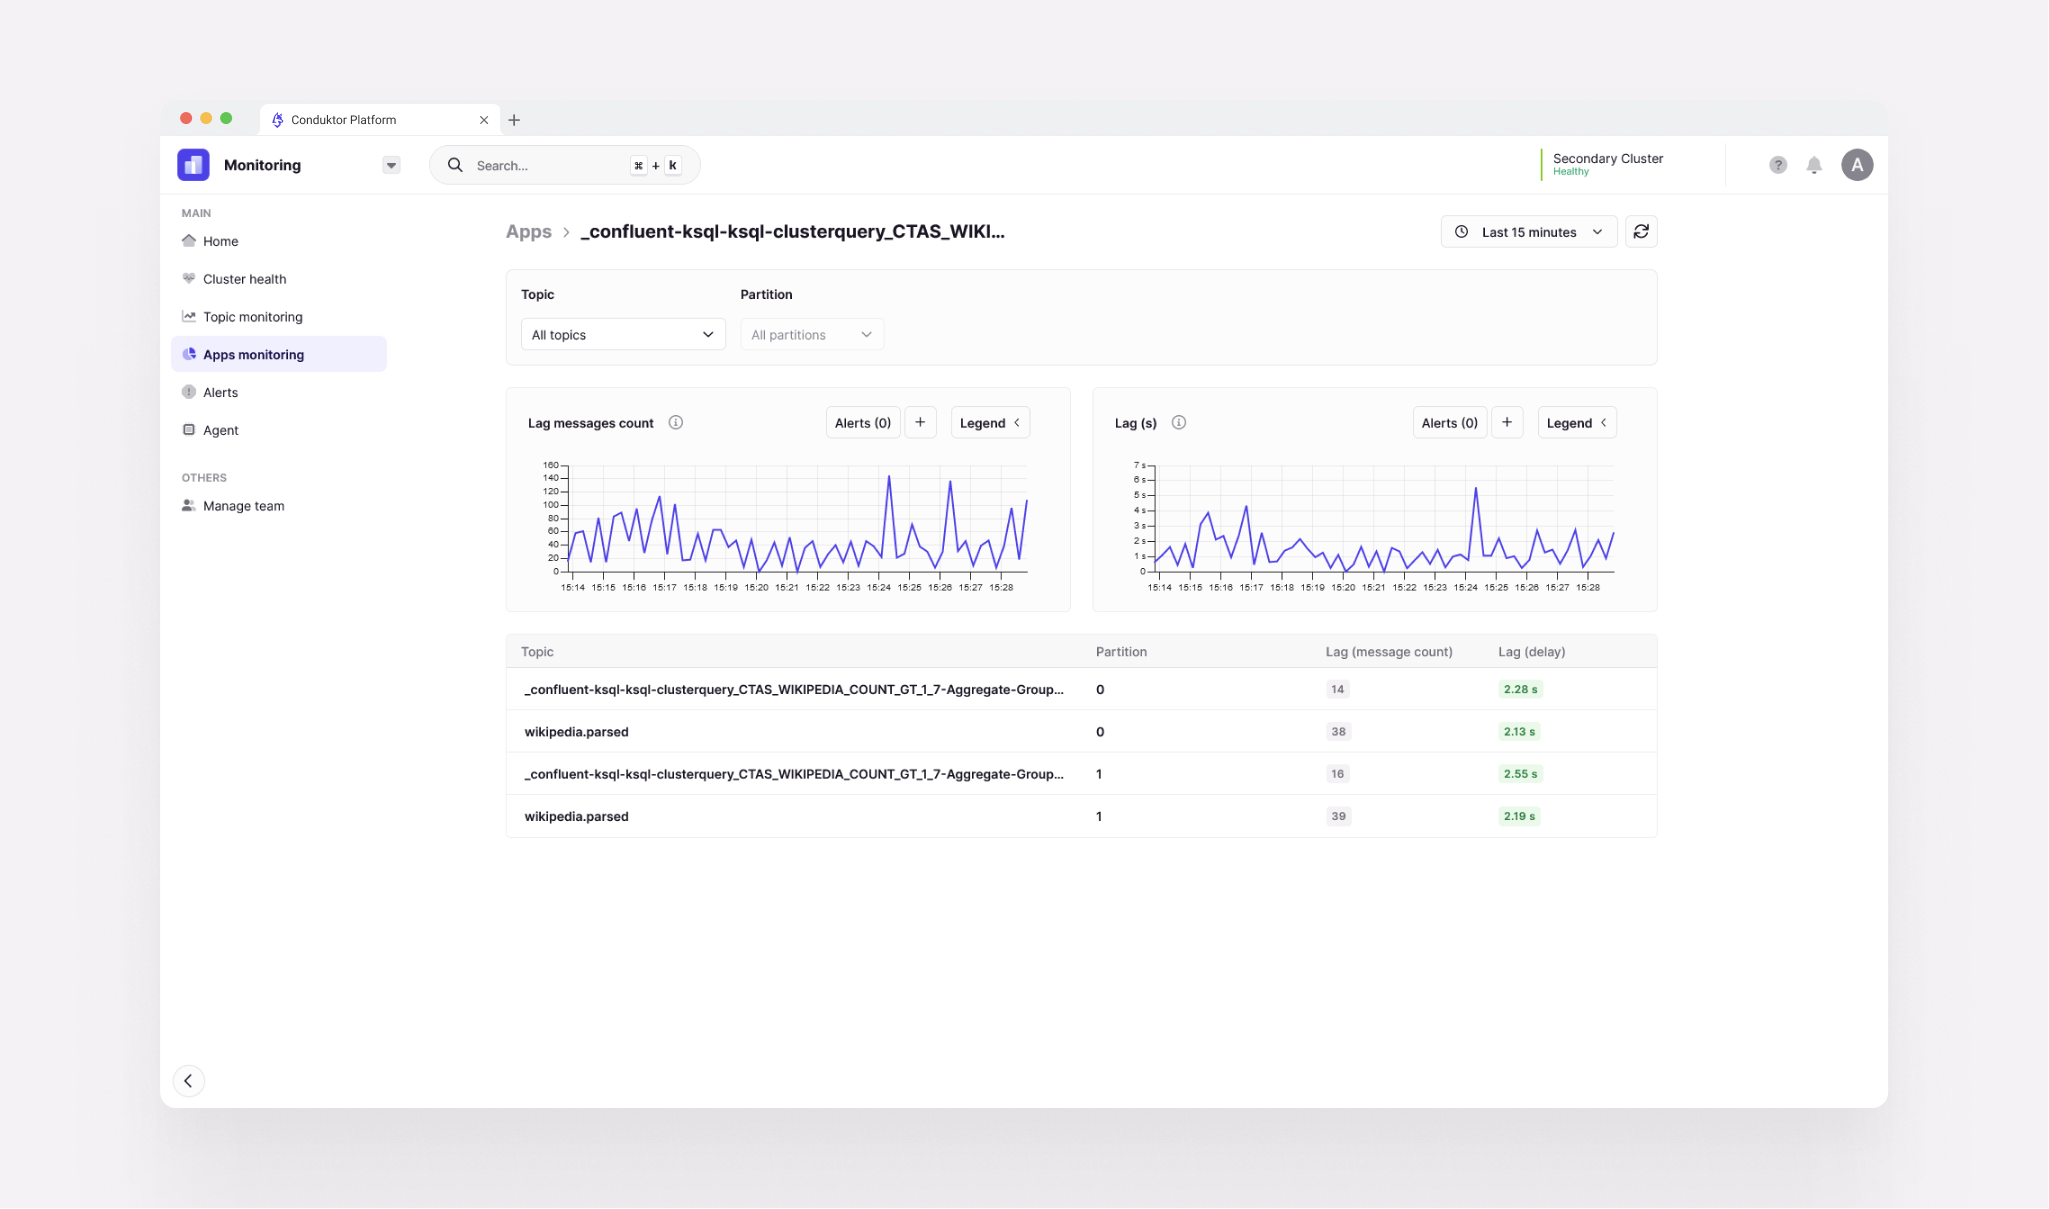
The App monitoring is focused around lag: lag in seconds, lag in messages, and so on. What applications actually care about are messages being processed, and we graph that over time. Everything in here is graphed over time.
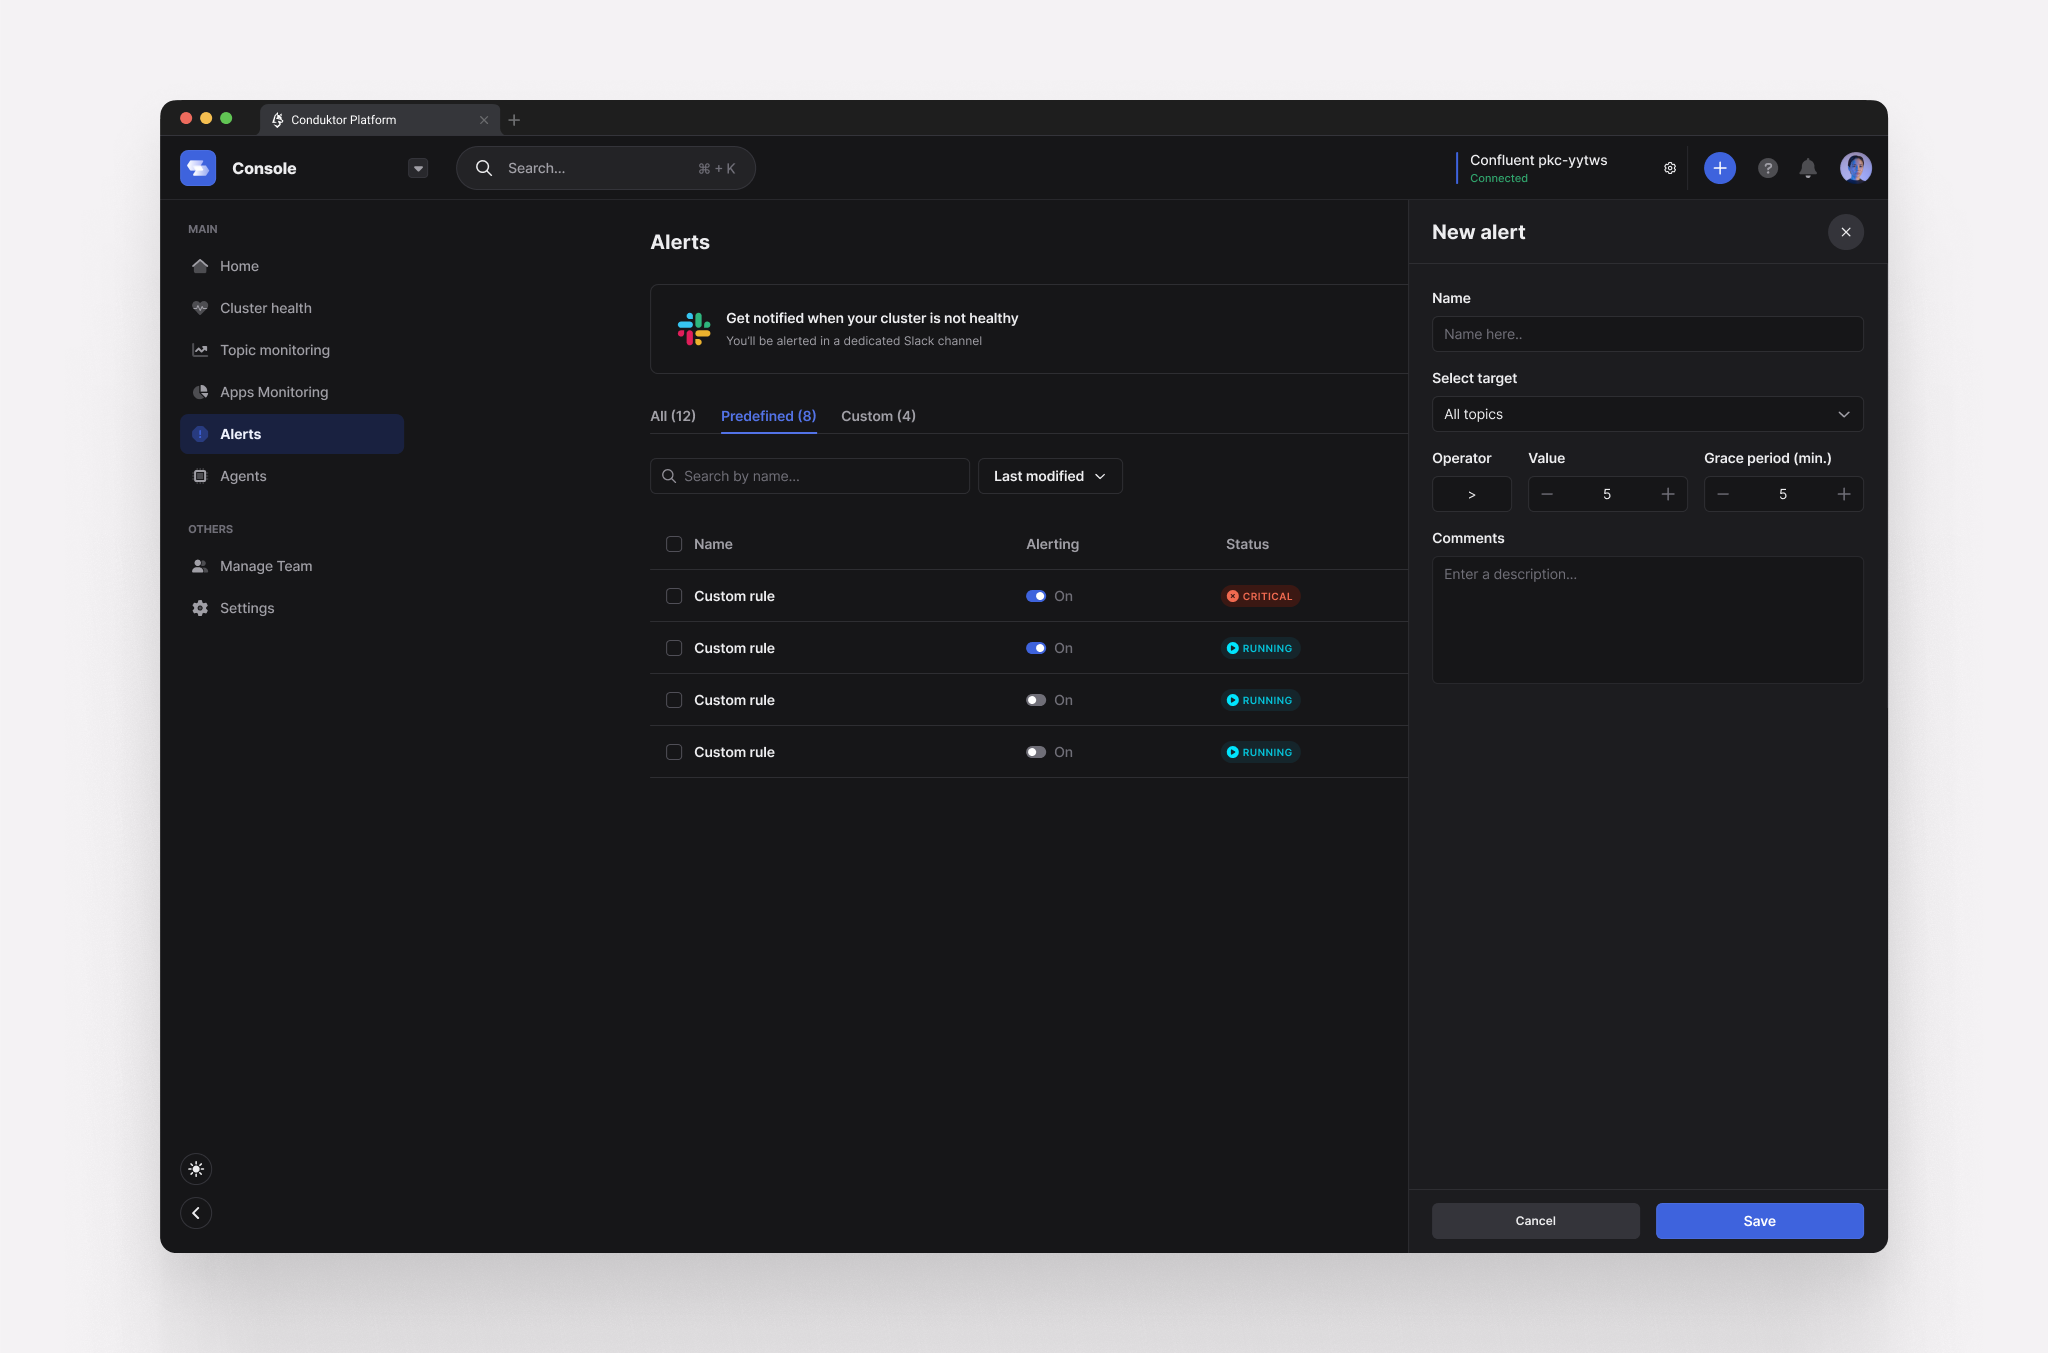
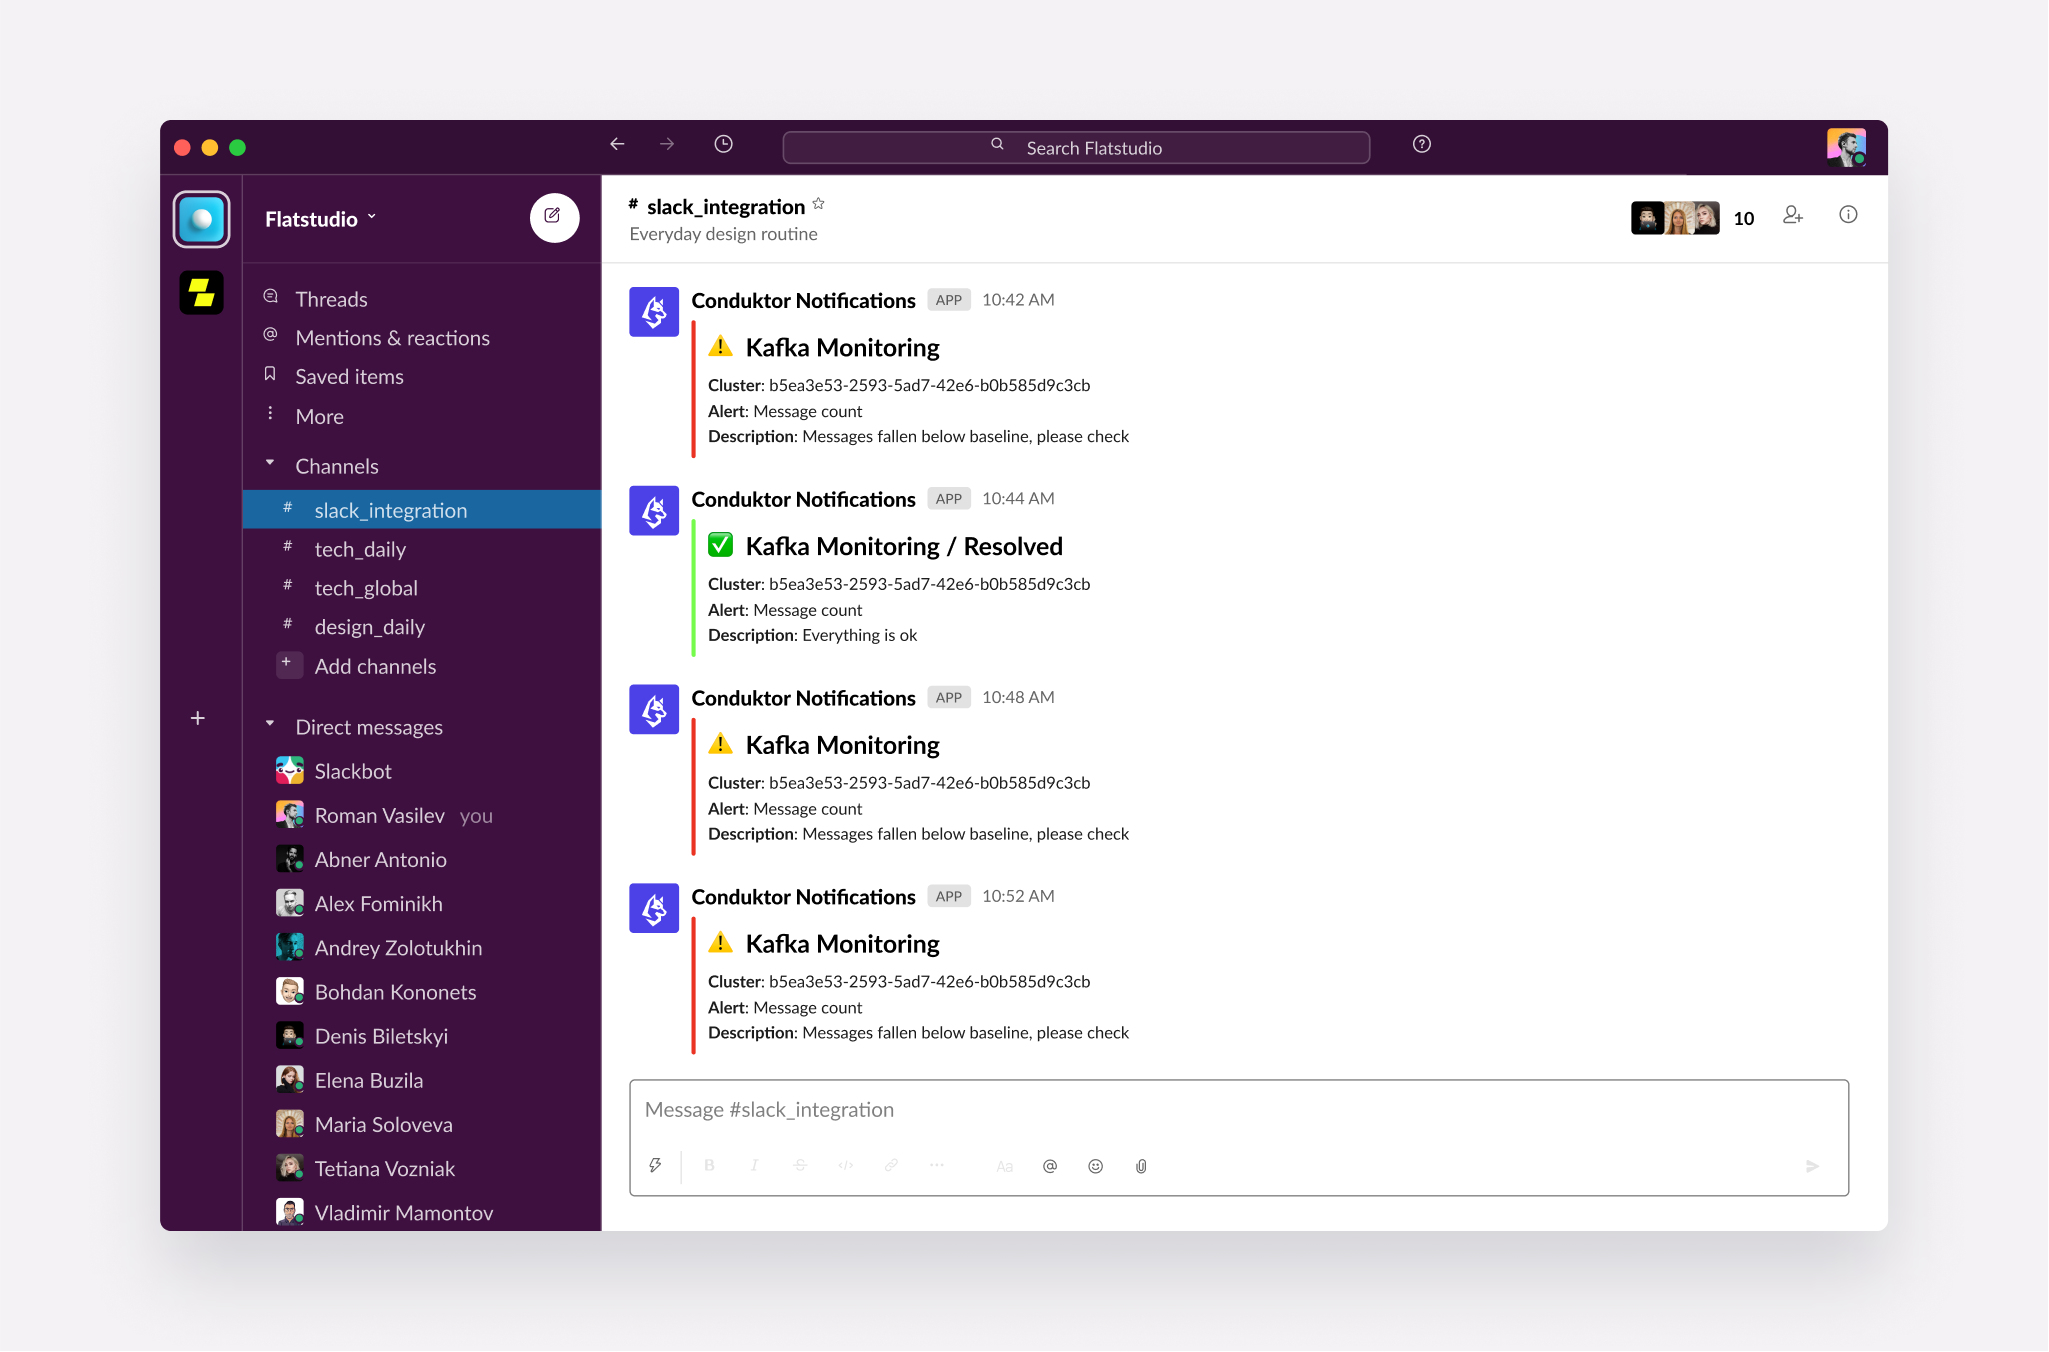
Alerts are self-service and configurable at the metric level, enabling users to have fine-grained control over what comes to their attention and what can be left alone. When alerts are needed, Conduktor delivers them in an easy-to-understand form, getting to the heart of the issue. The intention of Conduktor Alerting is that any Kafka user can take action from an alert, rather than funneling everything to Ops or Senior devs.
Monitoring and Alerting just work, fitting straight into the Conduktor Platform. At any time you need you can add Monitoring and Alerting to your existing Kafka UI with zero disruption. The tests, monitoring, security features, administrator features, data quality, and everything else that belongs to the Conduktor Platform all fit together with no fuss.
Conduktor's monitoring and alerting will integrate with existing systems to enable you to centralize and avoid adding yet another tool for your Ops to look at. Currently, the following out-of-the-box integrations are available for alerts, with additional integrations in development:
Alerting Integrations
Slack
Webhooks (coming soon)
How do I get Started
Currently, Monitoring and Alerting are only available for the Docker version of Conduktor, but they are coming very soon to Conduktor Cloud. If you want to get a quick overview of the dashboards and metrics available, Monitoring is available in the Conduktor demo environment.
Setting up Monitoring requires the download and configuration of the Monitoring agent, which can be done in just a few lines. After that, everything is ready. Monitoring will automatically start on your clusters, topics, and applications. Alerts are similarly simple, with a number of built-in alerts that can be configured for Slack in under a minute.
Summary
For a deep dive blog, there hasn't been a huge amount of diving into technical details here. There's a good reason for that - with Conduktor Monitoring and Alerting, you won't need to know all the technical details. Implementation is practically instant. We surface the metrics that matter to you and your applications. Integrations are plug-and-play. Alerts are delivered in real-time, and like the dashboards only highlight what is important. What else needs to be said?
Start using Conduktor for free today and see how easy Monitoring can be.
We aim to accelerate Kafka projects delivery by making developers and organizations more efficient with Kafka.
