
Most Kafka "best practices" posts tell you what to configure. This one is about what happens when you think you configured it right, but the broker disagrees.
Many of these came from real issues reported by Conduktor customers. When something didn't behave as expected, we dug into the Kafka broker source code and the client libraries (Java producer, librdkafka) to understand why. We reproduced each of them on a 3-node KRaft cluster, in both Python (confluent-kafka) and Java.
The acks=all and min.insync.replicas=2 gap
This one surprised me, though it makes sense in hindsight. You set min.insync.replicas=2 on your topic, produce with acks=all, and assume your data is replicated before the broker acknowledges. Except if the topic has replication.factor=1, Kafka silently caps min.insync.replicas to 1 and accepts the write. No error. No warning.
Topic: gotcha-acks  RF=1  min.insync.replicas=2  ISR=[3]
Produce with acks=all → SUCCESS
There's a function in Partition.scala called effectiveMinIsr that does this:
private def effectiveMinIsr(leaderLog: UnifiedLog): Int =
    leaderLog.config.minInSyncReplicas.min(remoteReplicasMap.size + 1)
It reduces your configured min ISR to whatever is physically possible. With one replica, your min ISR is always 1 regardless of what you configured.
Why it works this way: without the cap, setting min.insync.replicas higher than the replication factor would make the topic permanently unable to accept writes. So Kafka picks reduced durability over total unavailability. The problem is the silence: no warning at topic creation, no warning at produce time. You can run for months thinking you have a safety guarantee you don't.
Monitor that
min.insync.replicas <= replication.factorfor every topic. Or better: alert on theUnderMinIsrPartitionCountJMX metric. Conduktor Gateway can enforce minimum replication factor at topic creation time, so this misconfiguration can't happen in the first place.
Your consumer offsets can just vanish
This one bites people who run batch jobs or seasonal consumers. Consumer group offsets have a retention period, default 7 days (offsets.retention.minutes=10080). Offsets are expired after the retention period has elapsed and the consumer group becomes completely empty (all consumers have left). A paused consumer still in the group keeps offsets alive.
Why the EMPTY check? Offsets are the consumer's bookmark. If Kafka expired an offset while a consumer was actively using that partition, the consumer would reset to earliest/latest on the next poll. That's data loss. The EMPTY state is Kafka's way of saying "nobody is relying on this offset right now, safe to clean up."
When the consumer restarts, it falls back to auto.offset.reset, which is often latest. Messages produced while the consumer was down are silently skipped.
Configure offsets.retention.minutes=1 and offsets.retention.check.interval.ms=5000 to speed up the check cycle and watch:
Committed offset now: 5
+10s: committed offset = 5
+20s: committed offset = 5
...
+70s: committed offset = GONE!
After 70 seconds, the offset disappeared. Now, when the consumer will restart, it will miss these messages.
Set
offsets.retention.minutesexplicitly. The default 7 days is too short for seasonal jobs. Alert when a consumer group transitions fromStabletoEmptyfor more than N hours. For critical consumers, store offsets externally alongside processed data.
Transactions can freeze your data pipeline
When a transactional producer begins a transaction and doesn't commit or abort (because killed), the Last Stable Offset (LSO) can't advance past the transaction's starting position. Any read_committed consumer is blocked.
Any non-transactional messages produced after the transaction started are also invisible. The LSO is a partition-level watermark. Everything above it is hidden from read_committed consumers, regardless of whether those messages are part of a transaction.
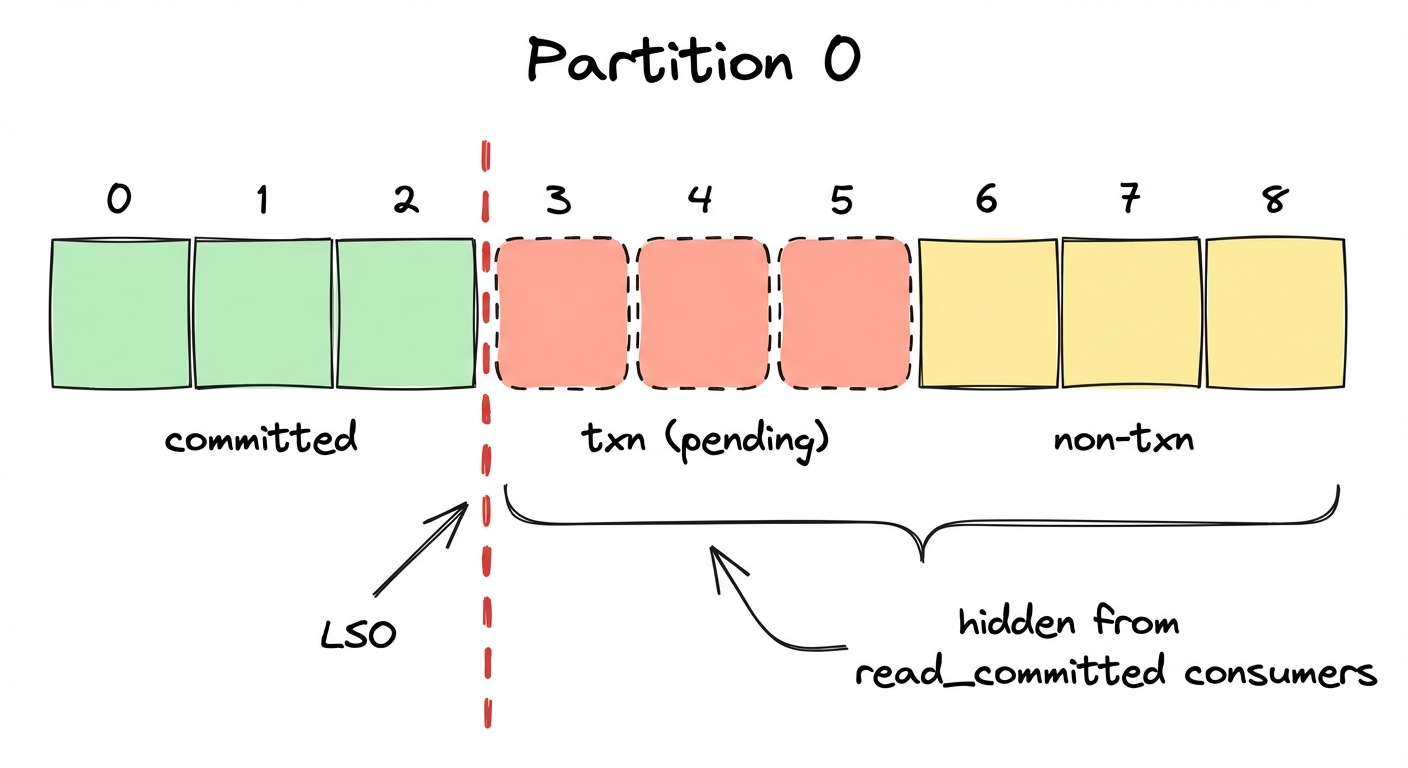
Why block non-transactional messages too? The broker has no way to tell which messages are safe to expose while a transaction is still open. If you opted into read_committed, you asked for a transactionally consistent view, so Kafka holds everything past the earliest unresolved transaction boundary, transactional or not.
3 txn msgs (not committed) + 3 normal msgs after
read_committed:   0 messages
read_uncommitted: 6 messages
If a transactional producer crashes without aborting, your entire partition is frozen for read_committed consumers until transaction.timeout.ms expires (default: 60 seconds). Note: transaction.timeout.ms is a producer-side config, but the broker caps it at transaction.max.timeout.ms (default: 15 minutes). A misconfigured producer could block consumers for up to 15 minutes.
Alert on consumer lag for
read_committedgroups and monitorLastStableOffsetLag. A growing gap between LSO and log-end offset means a transaction is hanging.
A future timestamp makes a segment immortal
Log retention is based on the segment's largest timestamp. If a single message in a segment has a timestamp in the future (clock skew, a bug in the producer, a bad epoch conversion), the entire segment becomes ineligible for deletion.
Create a topic with retention.ms=5000 (5 seconds), produce a message with a timestamp one year in the future, and wait:
offset=5  ts=1805819138560  value=future-message    ← still here after a while
offset=6  ts=1774283140574  value=after-0
The broker logs a WARN when it skips a segment due to a future timestamp, but only one log line, easy to miss in a noisy broker environment. There is no metric, no alert, no client-visible error. The segment simply stays.
Why not use wall-clock time? Retention is defined as "retain messages produced within the last N ms," and Kafka uses message timestamps as the source of truth for production time. Wall-clock would break offsetsForTimes (timestamp-based seeking), which relies on timestamps correlating to log position. The cost: a producer with a bad clock can make segments immortal.
Both timestamp gotchas (#4 and #5) only apply when
message.timestamp.type=CreateTime(the default). Setting it toLogAppendTimemakes the broker overwrite all message timestamps with its own clock at write time, which eliminates both problems. The tradeoff: you lose the original event time, which matters if you use timestamp-based seeking or event-time processing.
Segment rolling uses message timestamps, not broker time
segment.ms controls how often Kafka rolls a new log segment. You'd expect this to be based on the broker's clock. It isn't. The roll decision uses the timestamps embedded in the messages.
I set segment.ms=60000 (60 seconds) and segment.bytes=1GB (large, to not have any effect). Then I produced 10 messages within a single second of wall-clock time, but with timestamps spaced 2 minutes apart.
10 messages sent in <1s
segment.ms = 60s
segment.bytes = 1GB
Result: 10 separate log segments
The roll decision compares the largest timestamp in the current segment against the first message's timestamp. When the difference exceeds segment.ms, a new segment is created. With 2-minute gaps and a 60-second threshold, every message triggered a roll.
Why timestamps instead of wall-clock? Replicas need to roll segments at the same offset. If each broker used its own clock, clock skew would cause leaders and followers to roll at different positions, and log files would diverge. Message timestamps are the same on every replica, so the roll point is deterministic.
In production, this can happen when producers embed timestamps from upstream systems with different clocks, or when replaying historical data. You end up with thousands of tiny segments that slow down broker startup, increase memory usage, and confuse monitoring.
Use
message.timestamp.difference.max.ms(broker-side) to reject messages with timestamps too far from broker time. For replay pipelines, considermessage.timestamp.type=LogAppendTimeto let the broker stamp messages with its own clock.
Unclean leader election forcibly resets the ISR
When an unclean leader election happens, you might expect the ISR to grow gradually as replicas catch up. Instead, the ISR is forcibly overwritten to contain only the new leader:
// Illustrative, based on KIP-704, ReplicationControlManager.java
if (electionResult.unclean) {
    record.setIsr(List.of(electionResult.node));
    record.setLeaderRecoveryState(LeaderRecoveryState.RECOVERING.value());
}
I tested this with a RF=2 topic to show exactly how data gets lost:
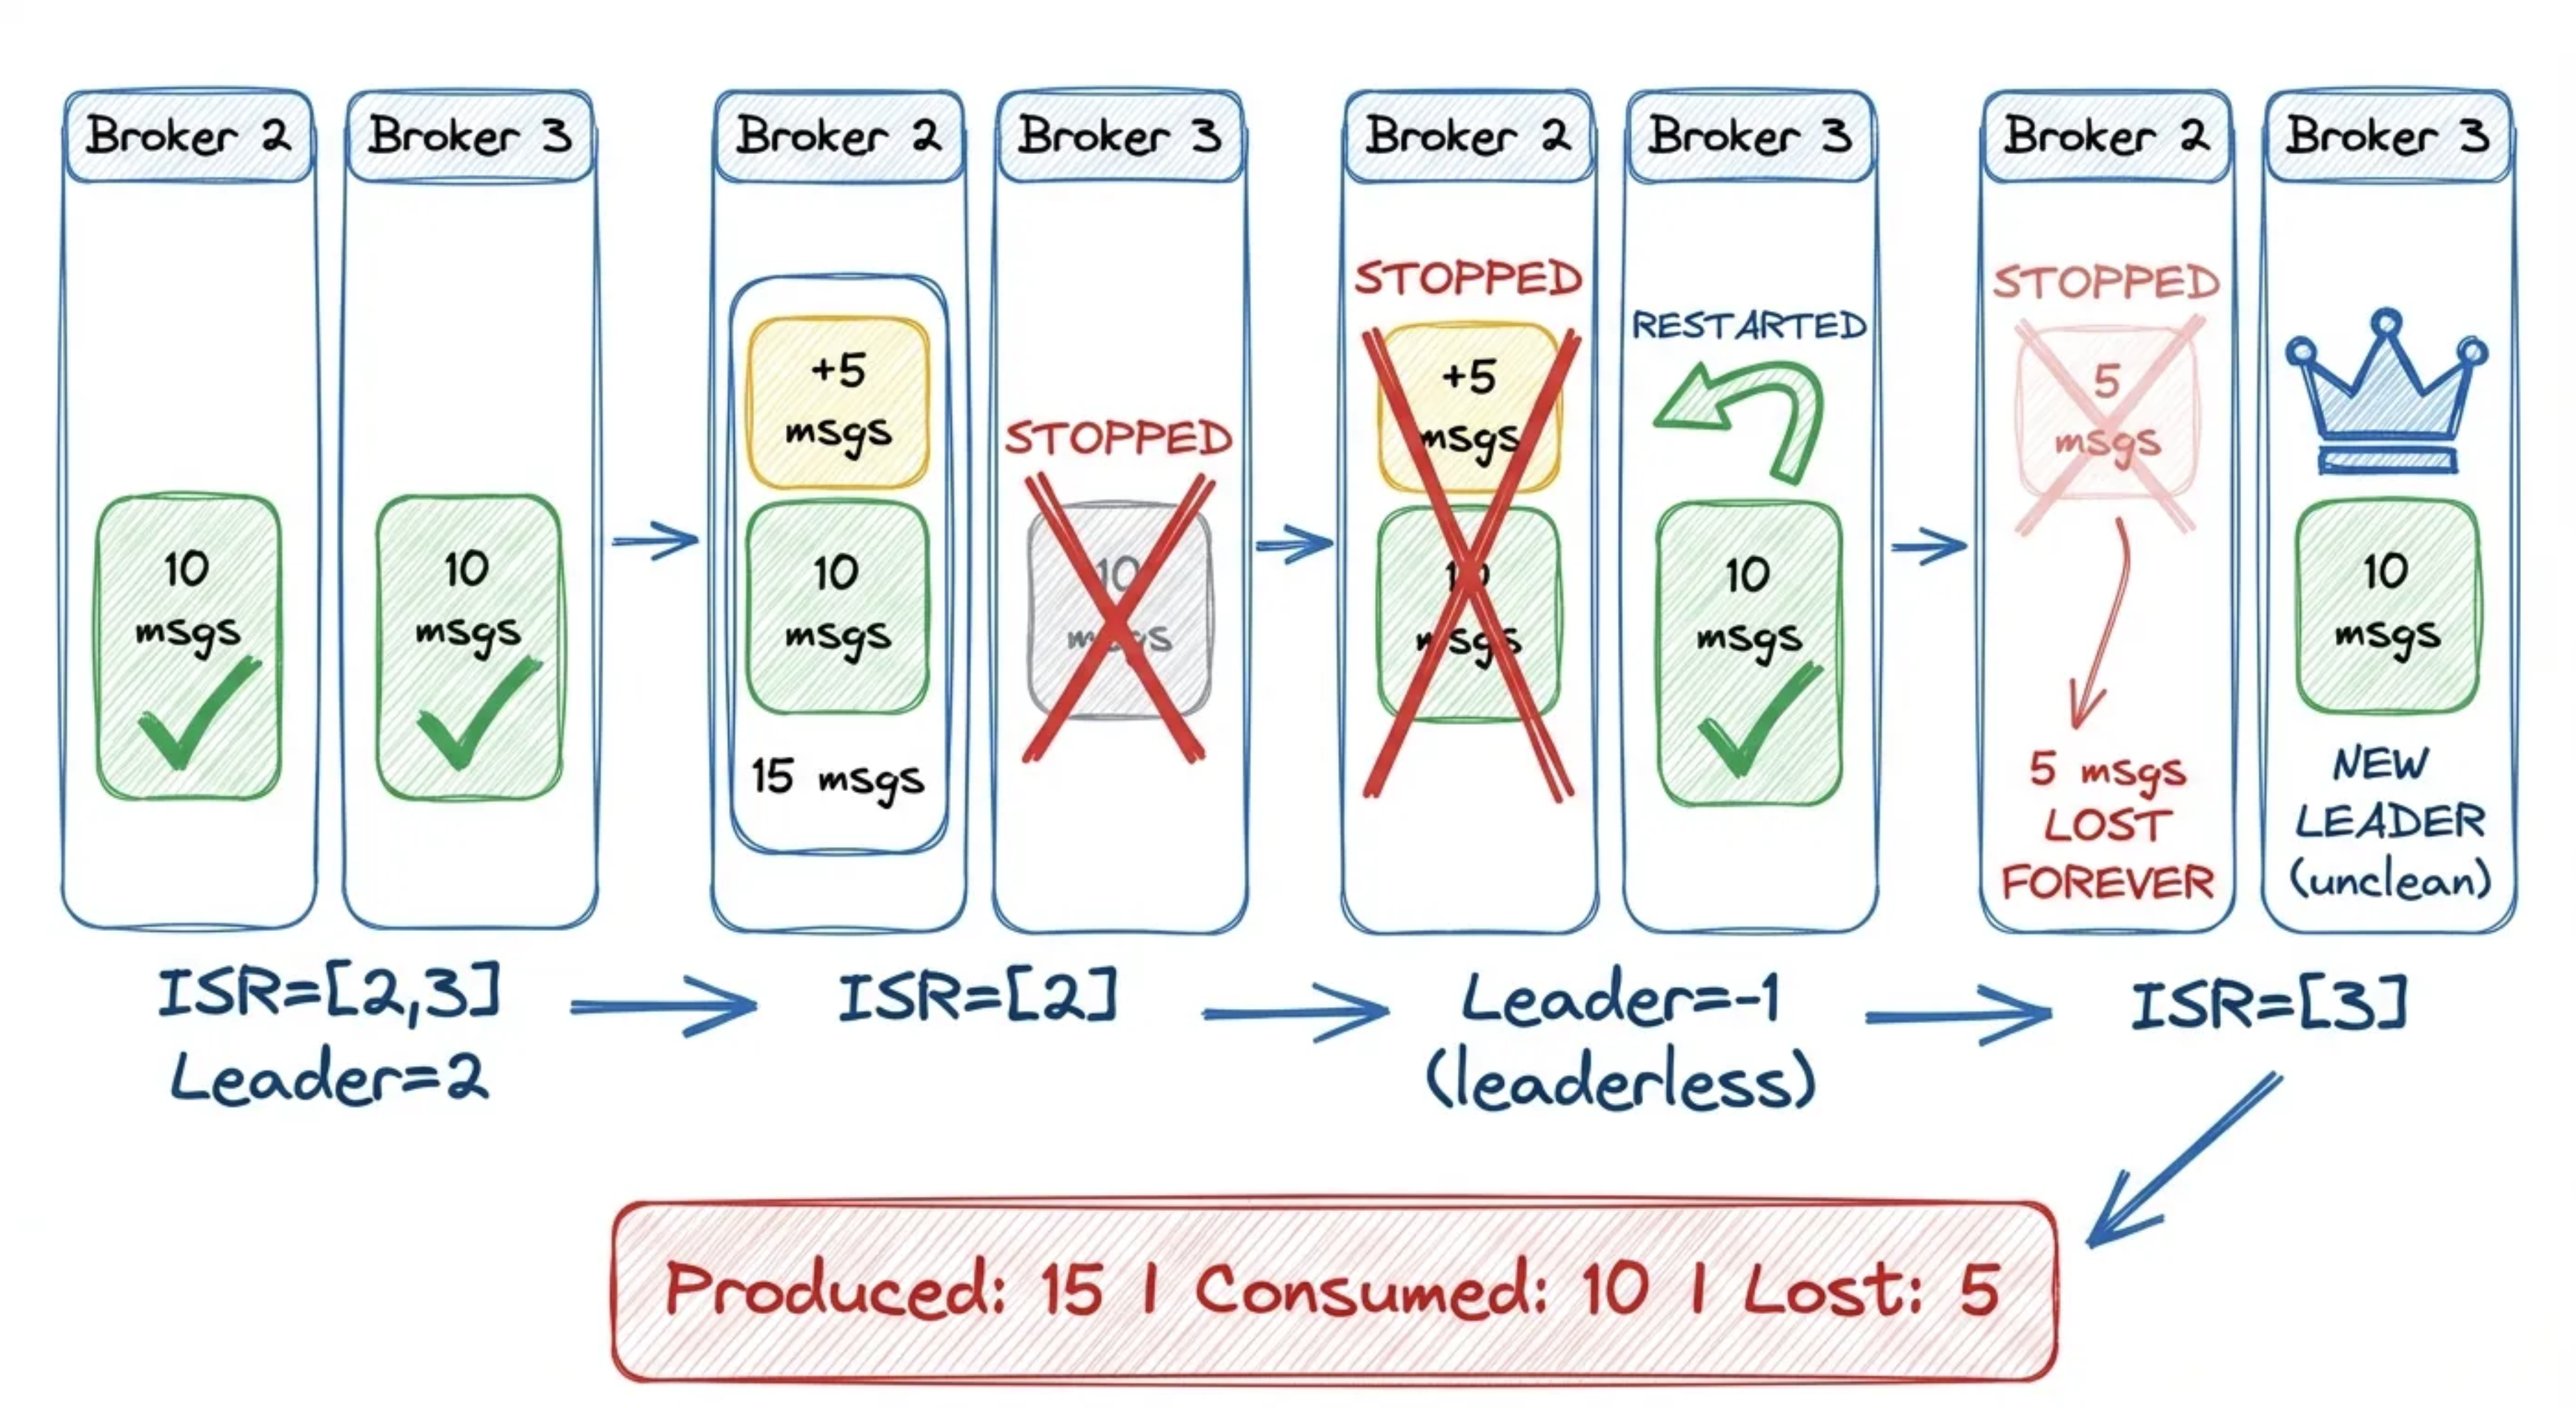
- Step 1: ISR=[2,3]
- Step 2: Produce 10 messages
- Step 3: Stop broker 3 (follower), ISR shrinks
- Step 4: Produce 5 MORE messages
- Step 5: Stop broker 2 (leader), partition leaderless
- Step 6: Restart broker 3, unclean election
Broker 3 became leader through unclean election, but it never received the five messages that were written while it was down. Those messages existed only on broker 2, which is still stopped.
Why force-reset the ISR? The elected replica wasn't in the ISR. It may be missing committed data. Keeping the old ISR would immediately flag violations and confuse the replication state machine. A singleton ISR is a clean slate: it tells followers "replicate from scratch from this new leader." The RECOVERING state suppresses min-ISR alerts until the partition has enough followers again.
Set
unclean.leader.election.enable=falseat the broker level. This prevents out-of-sync replicas from becoming leader (unavailability over data loss). Pair withmin.insync.replicas=2andreplication.factor=3. Alert onUncleanLeaderElectionsPerSec: any non-zero value is a data loss event. Conduktor Gateway can override produceracksat the proxy layer, soacks=allis enforced regardless of what clients set.
The controllerId in MetadataResponse is random
If you're building tooling that reads the controller field from MetadataResponse to find the cluster controller, you'll get "an" answer in KRaft mode.
In ZooKeeper mode, this field returned the actual controller broker. In KRaft, the architecture splits into two planes: the broker plane (data) and the controller plane (Raft consensus). Clients connect to the broker plane. The controller plane has its own listener (controller.listener.names) that is not advertised to clients. Among the N controller nodes, one is the Raft leader (roughly equivalent to the old ZK controller), but clients can't reach it directly.
Since the controllerId field in MetadataResponse is supposed to tell clients where to send admin requests (CreateTopics, DeleteTopics, etc.), and the actual controller isn't reachable by clients, there's no meaningful value to return. Any broker can forward admin requests to the controller internally, so Kafka picks a random alive broker as a placeholder. The field exists for protocol compatibility with older clients. In combined mode (broker + controller on the same node), you'll get a real node ID. In dedicated mode, you get this:
10 MetadataResponse queries:
  Broker 1: 4 times
  Broker 2: 4 times
  Broker 3: 2 times
Use the Admin Client's
describeCluster()API instead of parsingMetadataResponsedirectly. In KRaft dedicated mode, the controller ID is not exposed to data-plane clients by design.
Quota throttling makes fetch.max.wait.ms irrelevant
When a consumer exceeds its fetch quota, the broker doesn't enter the fetch purgatory at all. It returns an empty response immediately with a throttle_time_ms. The server-side behavior bypasses fetch.max.wait.ms.
Why skip purgatory? A throttled fetch sitting in purgatory would tie up a watcher entry per partition for the whole throttle duration. That's extra memory pressure from a client that's already misbehaving. Instead, the broker returns an empty response with throttle_time_ms and moves on. The client is told "wait this long before retrying" and the broker holds no state.
But you won't see this from the client side. Both the Java client and librdkafka handle throttle_time_ms internally: they pause before sending the next fetch request, making poll() appear to block normally.
Normal consumer:    5 msgs in 0.2s
Throttled consumer: 0 msgs in 25.0s
The throttled consumer got zero messages across five polls. The broker returned empty data immediately each time, and the client waited client-side before retrying.
Monitor
fetch-throttle-time-avgandfetch-throttle-time-maxclient metrics. If you use quotas, set them explicitly per client ID and alert whenthrottle_time_ms > 0appears in broker logs. Conduktor Gateway can enforce rate limits at the proxy layer with full visibility into throttle events, without touching broker configs.
enable.auto.commit is not as safe as you think
There's a persistent belief that enable.auto.commit=true causes duplicate processing during rebalances. It's not that simple.
With enable.auto.commit=true and no ConsumerRebalanceListener, the Java consumer does not guarantee a commit fires before partition revocation. Auto-commit fires on a timer inside poll(), not as a pre-revoke hook. If the interval hasn't elapsed at the moment of rebalance, offsets for revoked partitions may not be committed.
What actually happens internally: before sending a JoinGroup request, the consumer does fire an async commit and blocks waiting for it to complete (bounded by the rebalance timeout). But this is best-effort: if the commit fails or times out, the rebalance proceeds anyway and offsets are lost. If you want "no duplicates during rebalance", implement a ConsumerRebalanceListener and call commitSync() inside onPartitionsRevoked(). That's where the guarantee actually comes from, not from auto-commit.
But the bigger danger is crashes. If a consumer process dies (kube restart, OOM, rolling upgrade not properly handled etc.) between auto-commit intervals, nothing is committed. The next consumer starts from the last committed offset and reprocesses everything since then. (at-least-once means more than once)
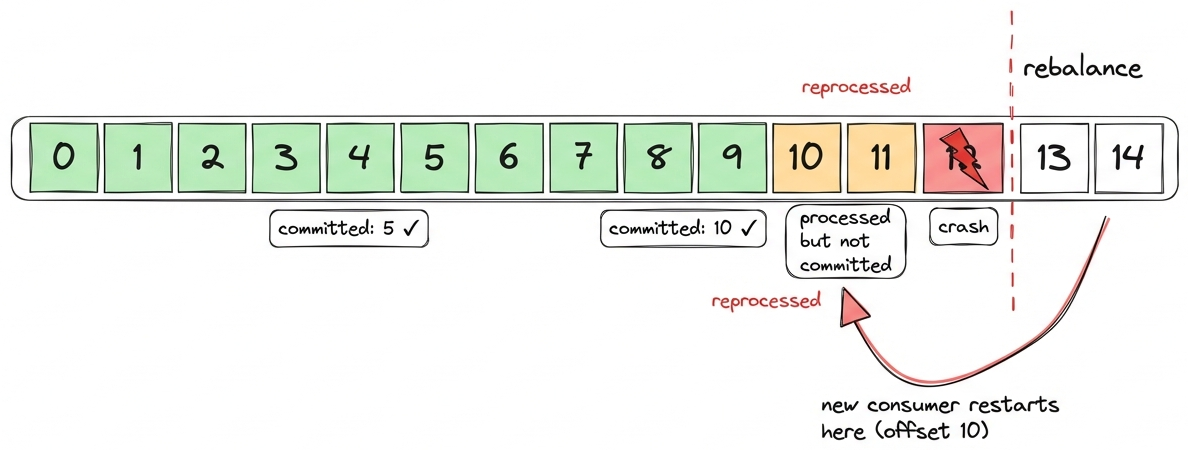
You can test this by killing a consumer process that had consumed 20 messages but whose auto-commit hadn't fired yet (interval defaults to 5 seconds):
C1 consumed: 20 messages (then killed)
Committed offset after crash: NONE
C2 consumed: 20 messages (from offset 0)
Total: 40 consume events for 20 messages
Every message processed twice. With the default 5-second interval, the re-processing window is small but still exists, hence why you have to make sure your consumers are idempotent (ignore the records already processed on their side), as any crash between commits = duplicates.
Implement a
ConsumerRebalanceListenerwith explicitcommitSync()inonPartitionsRevoked(). For crash resilience, make your processing idempotent: store offsets alongside processed data so you can detect and skip duplicates.
Your compression may silently be disabled
You set compression.type=gzip on your producer and assume every batch lands compressed on the broker. Reasonable assumption. But if you're using librdkafka (Python confluent-kafka, Go, C#, C/C++), some batches may arrive uncompressed, and nobody will tell you.
librdkafka compresses each batch, then compares the compressed size to the original. If the compressed output is larger, it throws it away and sends the batch as NONE:
if (ciov.iov_len > len) {
    /* If the compressed data is larger than the uncompressed size
     * then throw it away and send as uncompressed. */
    rd_free(ciov.iov_base);
    return -1;
}
I tested this with debug=msg enabled. With batch.num.messages=1 and a single small message, every batch is sent uncompressed because gzip header overhead (~20 bytes) exceeds the savings:
batch.num.messages=1, compression.type=gzip, value=1 byte
→ "Produce MessageSet with 1 message(s) (69 bytes, uncompressed)"

batch.num.messages=100, compression.type=gzip, values=UUIDs
→ "Produce MessageSet with 100 message(s) (2647 bytes, gzip)"
With 100 UUIDs batched together, gzip wins and the batch ships compressed. But one message per batch? Always uncompressed.
This happens whenever records don't compress well: UUIDs, already-compressed payloads (JPEG, Protobuf with bytes fields), encrypted data, or very small messages where the compression header overhead exceeds the savings.
The Java producer does not do this. It always sends compressed bytes, even when they're bigger than the original. It tracks compression ratios per topic via CompressionRatioEstimator, but only for batch sizing, never for codec switching.
The broker side matters too. If the topic has compression.type=producer (the default), whatever the producer sends is stored as-is. A librdkafka batch that fell back to NONE stays uncompressed on disk. If the topic has an explicit codec like gzip, the broker will re-compress the batch regardless, but at the cost of broker CPU.
So the same compression.type=gzip config produces different on-disk results depending on which client library you use, and on what your data looks like.
Monitor on-disk topic size relative to throughput. If a topic configured with compression is larger than expected, check the
compressionfield in batch headers usingkafka-dump-log.sh. For librdkafka clients, thecompression_rate_avgmetric per topic will tell you what's happening.
max.request.size rejects messages before compression
This one is easy to hit if you produce large JSON or Avro payloads with compression enabled. The Java producer checks max.request.size against the uncompressed serialized size of your record. Compression happens later in the pipeline, after the record enters the batch. If the uncompressed record exceeds max.request.size, it's rejected with RecordTooLargeException before it ever gets compressed.
I tested this on Kafka 4.0: 300 KB of highly compressible data (all a), which gzip reduces to ~300 bytes. With max.request.size=100000:
compression.type=gzip, max.request.size=100000
Uncompressed: 307287 bytes  → would compress to ~300 bytes
Result: RecordTooLargeException
  "The message is 307287 bytes when serialized which is larger than 100000"
The message would have been ~300 bytes on the wire. The broker would have accepted it. But the client never got that far.
The asymmetry: the producer checks uncompressed size against max.request.size, while the broker checks compressed (on-wire) size against message.max.bytes. The Java producer docs even acknowledge this: "Note that the server has its own cap on the record batch size (after compression if compression is enabled) which may be different from this."
In practice, this means you may need to set max.request.size higher than message.max.bytes when using compression with large but compressible payloads. Otherwise the client rejects records that the broker would happily accept.
If you use compression and produce large records, set
max.request.sizebased on your largest uncompressed record, not on the broker'smessage.max.bytes. Watch forRecordTooLargeExceptionin producer logs. For librdkafka (confluent-kafkaPython/Go/C#), the equivalent config ismessage.max.bytesand the same pre-compression check applies.
Kafka rewards the paranoid
None of this is Kafka being broken. Each of these is a design choice that makes sense once you understand the tradeoff. The problem is that nobody tells you about the tradeoff until you've already been running in production for months.
If you take one thing away from this post, audit these configs before your next incident:
replication.factor >= 3andmin.insync.replicas = RF - 1for all critical topicsunclean.leader.election.enable=falsecluster-wideoffsets.retention.minutesreviewed against your longest consumer idle windowmessage.timestamp.type=LogAppendTimefor any topic receiving data from external or historical systems- Alerts on:
UnderMinIsrPartitionCount,UncleanLeaderElectionsPerSec,LastStableOffsetLag, consumer group state transitions
Conduktor Insights flags most of these automatically—data loss risk from low RF, misconfigured min.insync.replicas, unbalanced partitions—so you don't have to audit configs by hand.